February 1, 202621 min readJérôme Dard
Portfolio management vs project management: definition, methods and tools

Contents
What is project portfolio management?
Project portfolio management, or PPM, is a strategic discipline that consists of selecting, prioritizing and steering all of an organization's projects to maximize value creation.
Unlike project management, which is about "doing projects right" (the operational domain), project portfolio management is about "doing the right projects" (the decision-making domain).
The Project Management Institute (PMI) defines it as the centralized management of the processes, methods and technologies of a set of projects, used to optimize trade-offs and planning while assessing each project's risk level and financial viability.
In concrete terms, a project portfolio brings together all of a company's projects, programs and operations. Much like a stock portfolio, the point is to decide where to invest your budget, resources and time to get the best return on investment.
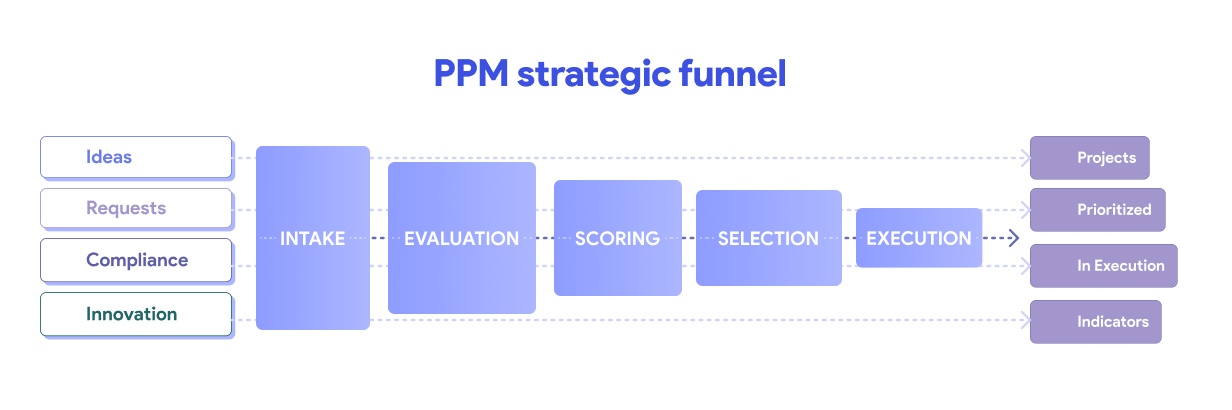
PPM works like a strategic funnel: at the top, a massive flow of ideas coming from strategy, customers or regulation; at the bottom, a rigorously selected set of coordinated, executable initiatives. Without this filter, the organization exhausts itself trying to run everything at once and condemns its projects to mediocre results.
What project portfolio management makes possible
- Ensure strategic alignment between projects and the company's vision
- Prioritize the initiatives with the highest added value
- Optimize resource allocation (people, budget, equipment) across projects
- Anticipate the risks of imbalance between capacity and demand
- Give decision-making bodies (steering committee, executive leadership) a consolidated view
- Stop or postpone projects that no longer create value
Capacity per team: the constraint at the heart of the portfolio
Project portfolio management rests on a truth many organizations refuse to face: team capacity is finite. And it is this constraint — not scoring matrices, not percent-complete figures — that should drive every decision.
In practice, capacity is measured per team and per quarter. That is the scale of the Quarter Plan: each team (infrastructure, development, data, security…) has a real number of person-days available for the coming quarter, once absences, maintenance, run activities and contingencies are deducted. This quarterly capacity is your portfolio's true budget — far more structuring than the financial one.
| Resource management | Capacity planning | |
|---|---|---|
| Horizon | Short term (week/sprint) | Quarterly (Quarter Plan) |
| Granularity | Individual by individual | Team by team |
| Key question | "Who is working on what this week?" | "Can this team absorb this project this quarter?" |
| Purpose | Optimize day-to-day assignments | Decide which projects enter the portfolio — and which ones wait |
Capacity planning is your portfolio's strategic guardrail: without it, you approve projects your teams will never be able to absorb.
Project portfolio vs program vs project: what's the difference?
These three concepts are frequently confused. Here is what sets them apart.
The project
A project is a temporary initiative aimed at producing a unique deliverable. It has a start, an end, a budget and SMART objectives (Specific, Measurable, Achievable, Realistic, Time-bound). Project management focuses on delivering that initiative successfully.
Example: Rolling out a new CRM tool for the sales team.
The program
A program is a set of interdependent projects that share common objectives. The projects within a program are linked: together they contribute to a strategic outcome.
Example: The "Digital transformation of the customer relationship" program, which brings together the CRM project, the website redesign project and the chatbot project.
The project portfolio
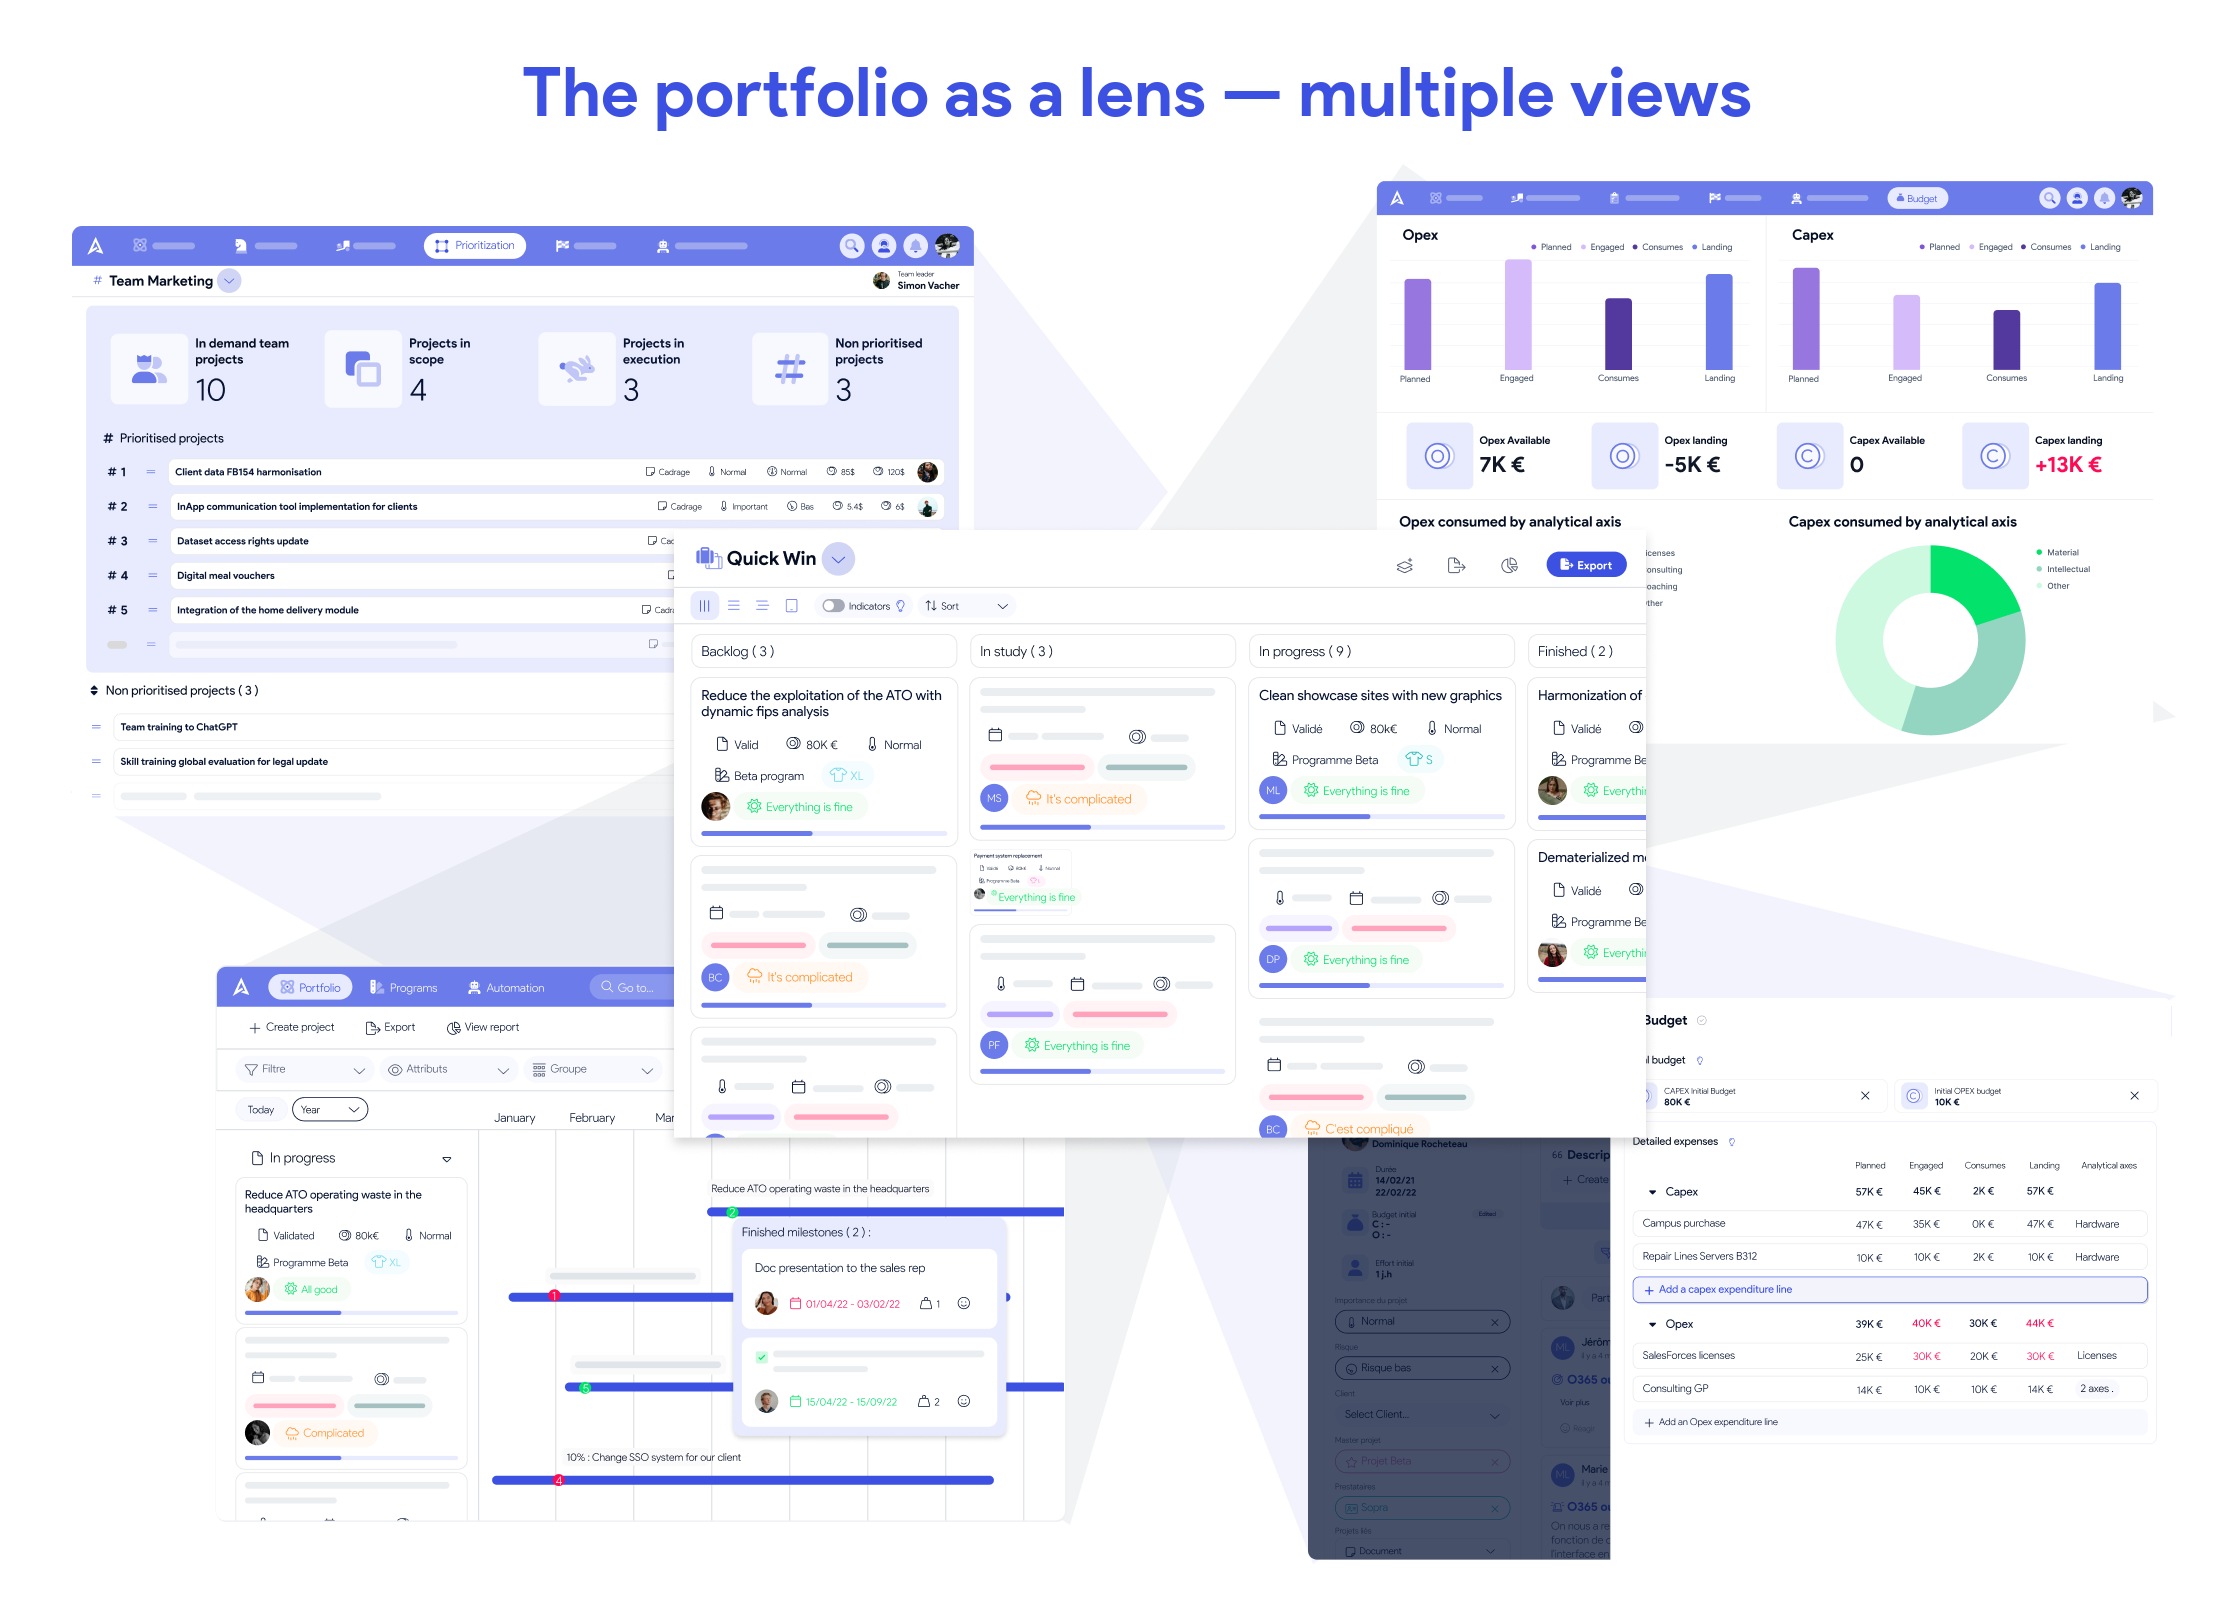
A project portfolio is not a hierarchical level above the program. It is a lens — a way of looking at a group of projects from a given angle, in order to make decisions suited to that scope.
In practice, a single organization handles several portfolios at once: the IT infrastructure team's portfolio, the business applications team's, the portfolio of mission-critical projects, the regulatory compliance portfolio, or the global portfolio as seen by executive leadership. Each view answers a different question: "Is my team overloaded?", "Are our critical projects moving forward?", "Are we aligned with the strategy?".
That is what makes project portfolio management so powerful: it does not impose a single frame, it offers the ability to filter, group and compare projects according to each stakeholder's needs — team, business unit, IT department or leadership team.
Example: The IT department steers a global portfolio, but each team (infra, dev, data) has its own portfolio view with its capacity constraints. The leadership team, for its part, looks at the portfolio by strategic pillar.
Comparison table
| Criterion | Project | Program | Portfolio |
|---|---|---|---|
| Nature | A temporary initiative with a deliverable | A set of projects linked by a common objective | A view over a group of projects, filtered by team, theme or strategic pillar |
| Goal | Deliver a concrete result on time | Achieve a shared strategic benefit | Decide what to do, what to stop, what to postpone — based on real capacity |
| Decision level | Operational | Tactical | Strategic |
| Core constraint | The cost/time/scope triangle | Coordination across interdependent projects | Team capacity — there will always be more projects than you can absorb |
| Owner | Project manager | Program director | PMO / CIO / executive leadership |
| Key question | "Will the deliverable be ready?" | "Are the projects producing the expected benefit?" | "Are the right teams working on the right topics, at the right time?" |
Why set up project portfolio management?
In most companies, the number of projects far exceeds the capacity to deliver them. It is a universal law of transformation: demand will always outstrip the supply of available resources.
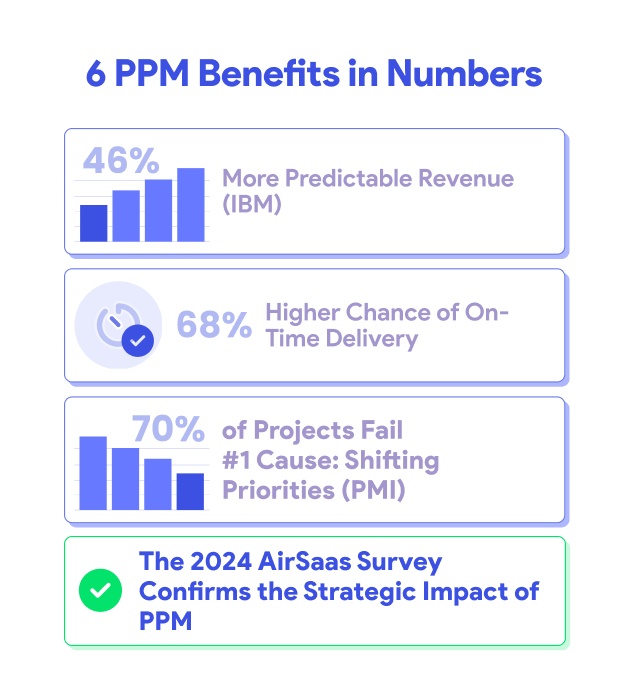
The numbers back it up: according to the IBM Institute for Business Value, organizations that lead in project portfolio management show 46% more predictable revenue performance than their less mature competitors. PPM excellence is not an organizational luxury — it is a measurable competitive advantage.
Without project portfolio management, organizations suffer from a well-known phenomenon: one emergency drives out the next. Teams operate on a "best effort" basis, trade-offs happen on the fly (or by executive whim), and no one has visibility into what is genuinely a priority.
The 6 concrete benefits of a project portfolio management approach
1. Strategic alignment
PPM guarantees that every project contributes to the company's strategy. No more "orphan" projects consuming resources without creating measurable value. Every euro invested is traced back to a strategic objective. A truth too often ignored: technical success ≠ business success. Flawless execution of a project with no strategic alignment is still a waste of resources.
2. Objective, transparent prioritization
By making the rules of the game visible, along with every topic under portfolio review, the approach builds a relationship of trust and transparency between the IT department, business units and executive leadership. Prioritization decisions are grounded in hard evidence, not in political power plays or the loudest voice in the leadership meeting.
3. Capacity optimization — the real added value
This is where project portfolio management truly earns its keep. Capacity is not measured at the scale of the whole organization — it is measured team by team, quarter by quarter. The Quarter Plan approach consists of confronting, every quarter, project commitments with each team's real bandwidth. Organizations that master this planning increase their chances of delivering projects on time by 68%. The secret: identify bottlenecks on critical skills (IT architects, domain experts, specialized engineers) and accept postponing whatever does not fit in the quarter. The result: less overload, fewer cascading delays, credible commitments.
4. Proactive risk management
With a consolidated view of the portfolio, risks are identified at the organization level, not just project by project. A risk on a structural project can impact the entire portfolio: PPM makes it possible to anticipate it.
5. Better communication with stakeholders
Consolidated portfolio reporting (dashboard, flash report, portfolio review) gives executives the data they need to make informed decisions, without having to dive into the details of every project.
6. Decision-making agility
Frozen 3-to-5-year IT roadmaps belong to the past. With modern PPM, prioritization happens continuously, at a pace suited to changes in the company's context. Field data flows up in real time, enabling quick adjustments.
🏢 Common misconception: "Project portfolio management is reserved for large companies." Wrong. SMEs and mid-sized companies can sometimes get even more out of it, because they have more agility and the ability to roll out the approach faster. The challenge is to adapt the level of formality to the size of the organization.
The 7 steps to deploy effective project portfolio management
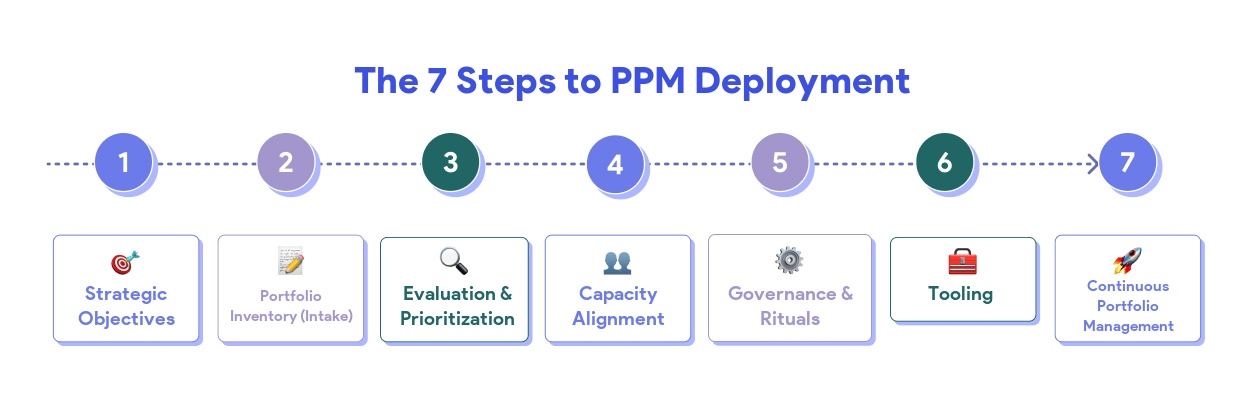
Step 1 — Define the strategic objectives
Everything starts with the compass. Without clarity on the strategy, your portfolio will be nothing but an incoherent inventory of projects.
Three concrete actions for this step:
- Formalize the 2-3 year vision with executive leadership
- Identify the priority strategic pillars (growth, efficiency, compliance, innovation...)
- Translate these pillars into measurable selection criteria for projects
Step 2 — Inventory and categorize all projects (Intake)
Create an exhaustive inventory of every current and upcoming initiative: approved projects, pending projects, ideas in gestation. Centralize all requests — strategic, regulatory, coming from business units or from customers — into a single intake (capture) process. It is the best way to eliminate redundancies and identify opportunities for pooling.
Each project should be documented with a standardized card including at minimum: objective, sponsor, estimated budget, required resources, deadline and strategic contribution.
Then categorize your projects by type (transformation, run, regulatory, innovation...) and by program if applicable.
Step 3 — Evaluate and prioritize projects
This is the heart of the approach. Apply your selection criteria to score and rank each project. Prioritization methods are detailed in the next section, but the essential point is to have a multi-criteria approach that combines business value, feasibility, risks and strategic alignment.
Step 4 — Align capacity with demand (Quarter Plan)
This is the most decisive step — and the most often botched. For each team, assess its real capacity for the coming quarter: available person-days, once absences, run, maintenance and a contingency margin are deducted. Then confront that capacity with project commitments.
This is often the moment of truth: what seemed a priority can prove unrealistic if the team involved is already saturated. The exercise must be concrete: not "do we have the means overall?", but "can the Data team absorb this project in Q2, or should it slip to Q3?"
The goal is not to plan everything to the day. It is to make sure commitments are credible. Better 5 projects delivered this quarter than 15 projects "in progress" none of which delivers a tangible result. Beware of the percent-complete trap: a project at "60%" does not mean it is close to delivering anything usable — it is often just a ratio of effort consumed.
Step 5 — Define governance and rituals
Set up the decision-making bodies and recurring rituals that will keep your portfolio alive:
- Monthly portfolio review: trade-offs, Go/No-Go decisions, resource reallocation
- Steering committee: validation of strategic directions and major investments
- Weekly reporting (flash report): consolidated progress update sent to stakeholders
- Weekly project check-in: 5 minutes per project between the project manager and the business owner
The PMI distinguishes three types of PMO (Project Management Office), depending on the level of control exercised:
| Type of PMO | Role | Level of control |
|---|---|---|
| Supportive | Provides templates, tools and best practices | Low — teams remain autonomous |
| Controlling | Requires compliance with methodologies through audits | Moderate — a structuring frame |
| Directive | Manages projects directly and assigns project managers | High — centralized steering |
The choice of PMO type depends on your organization's maturity and management culture. The current trend is the "facilitator" PMO (between Supportive and Controlling), which structures without adding bureaucracy. More broadly, success in 2026 requires a metamorphosis of the PMO: it must evolve from an administrative support role to that of a strategic partner. Strategic steering is not about watching calendars, but about guaranteeing that every euro and every hour invested serves the company's growth.
Without regular rituals, your portfolio will quickly become obsolete. It is the frequency and discipline of these rituals that create the value.
Step 6 — Equip the approach
Tracking a project portfolio in Excel is no longer viable beyond 10 projects. A dedicated PPM tool (Project Portfolio Management) centralizes information, automates reporting and gives all stakeholders real-time visibility.
The key criteria for choosing your PPM tool are detailed in the dedicated section below.
Step 7 — Steer continuously and improve
Project portfolio management is not a one-off exercise, it is a continuous process. At every portfolio review, ask yourself three questions:
- Are the projects under way still aligned with the strategy?
- Should any projects be added, postponed or stopped?
- Is capacity still sufficient to honor the commitments?
Prioritization methods for a project portfolio
Prioritization is the most complex and most political exercise in project portfolio management. Here are the most widely used methods.
Multi-criteria scoring
Each project is assessed against a grid of weighted criteria. The criteria usually fall into three families:
- Financial criteria: Net Present Value (NPV), Return on Investment (ROI), payback period
- Strategic criteria: alignment with annual objectives, customer impact, competitive differentiation
- Operational criteria: technical feasibility, probability of success, regulatory urgency, resource availability
Each criterion gets a score (for example from 1 to 5) and a relative weight. The total weighted score makes it possible to rank projects objectively and draw a cut-line: projects above it go ahead, those below are postponed or dropped. Enforcing the cut-line is the ultimate management act: once resources are consumed by the highest-scoring projects, everything below the line must be postponed or cancelled, without exception. It is the only way to guarantee that high-impact initiatives get the oxygen they need to succeed — and to protect the portfolio from pet projects devoid of real value.
Advantage: Transparency, reproducibility, easy to explain to stakeholders. Limitation: The quality of the scoring depends on the quality of the input data. As Robert Cooper, a portfolio management expert, points out: “The sophistication of financial methods often exceeds the quality of the data. Purely accounting-based methods sometimes produce the poorest results when they are not complemented by strategic judgment.”
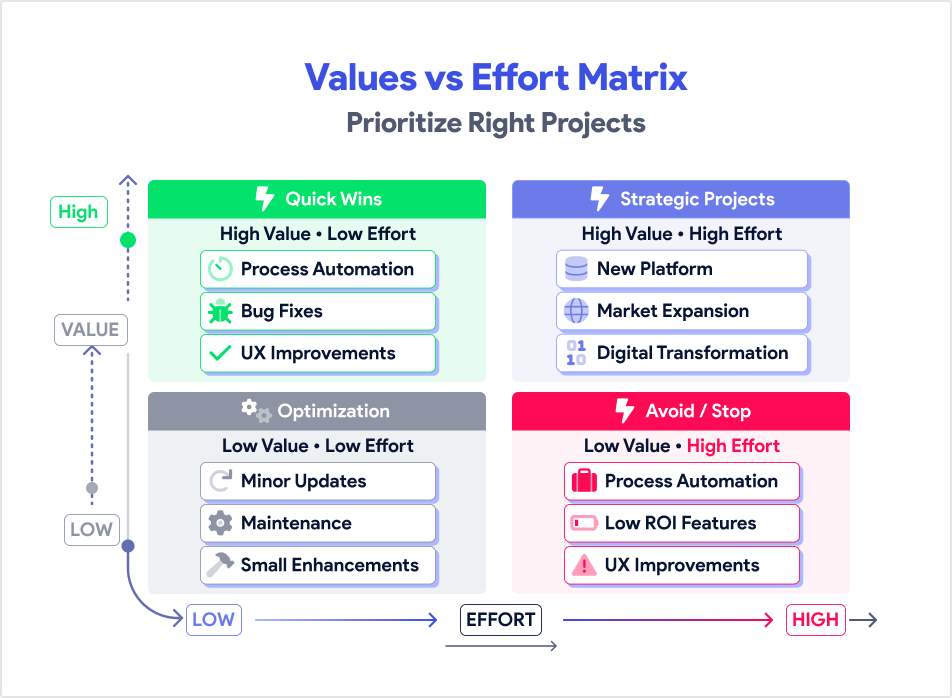
The value / effort matrix (and risk / reward)
This simple, visual approach positions each project on two axes: expected value (business impact) and required effort (cost, complexity, duration). High-value, low-effort projects (the "quick wins") come first.
A commonly used variant is the risk-reward matrix, which balances the portfolio across four quadrants: "Quick Wins" (low risk, high reward), strategic projects (high risk, high reward), optimization projects (low risk, low reward) and projects to avoid (high risk, low reward).
Advantage: Visual, quick to set up, excellent for prioritization workshops. Limitation: Reductive for complex projects with long-term impact
The MoSCoW method
Sort projects into four categories: Must have (vital), Should have (important), Could have (desirable), Won't have (not now). This method, born in the agile world, is particularly suited to situations where you need to decide fast.
The WSJF model (Weighted Shortest Job First)
Coming from the SAFe framework, WSJF prioritizes by dividing value (Cost of Delay) by effort size. The cost of delay combines three components: business/user value, time criticality (window of opportunity) and risk reduction or learning opportunity. Projects with a high cost of delay and a small size go first. It is the most widely used method in organizations that have adopted agile at scale.
The RICE method
RICE is a fast scoring model that evaluates each project along 4 dimensions: Reach (number of people impacted), Impact (degree of impact per person), Confidence (confidence level in the estimates) and Effort (workload required). RICE score = (Reach × Impact × Confidence) / Effort. The highest-scoring projects are prioritized.
Prioritization with Lean Portfolio Management
Lean Portfolio Management (LPM) goes further by embedding prioritization into a continuous flow, aligned with strategic objectives (OKRs or strategic epics). Capacity is allocated by "value stream" rather than by project, which allows far more agility in trade-offs.
| Characteristic | Traditional PPM | Lean Portfolio Management |
|---|---|---|
| Funding | Based on specific projects | Based on value streams |
| Planning | Rigid annual cycle | Rolling, iterative, adjusted every quarter |
| Governance | Centralized control (top-down) | Decentralized decisions with guardrails |
| Focus | Administration of individual projects | Overall economic performance of the portfolio |
The shift to LPM marks the end of rigid annual planning, often obsolete by the first quarter. You no longer fund isolated projects (the "Fire and Forget" approach), but continuous value streams. This agility is secured by three guardrails:
- Investment by horizon: balance between maintaining the existing estate, immediate gains (quick wins) and disruptive innovation.
- Capacity allocation: strict trade-off between developing new features and reducing technical debt.
- Outcome-based indicators: KPIs tied to real results (Outcomes) rather than mere task progress (Outputs).
"What-If" simulation analysis
Scenario analysis is a powerful lever to escape permanent crisis management and trade intuition for predictive impact analysis. A rigorous simulation rests on three steps:
- Identifying the variables: isolate the critical levers — budgets, availability of key skills, Cost of Delay, cross-project dependencies.
- Modeling scenarios: build optimistic, pessimistic and "most likely" trajectories to test the portfolio's resilience.
- Assessing the impact: precisely measure the potential drift in deadlines, costs and overall workload.
For example: simulate adding an urgent project to measure the shift in delivery dates of ongoing initiatives, or assess the impact of a 15% budget cut on the portfolio's composition. Modern PPM tools embed these simulation capabilities to inform trade-off decisions in the steering committee — putting an end to the reign of "the loudest voice" in the leadership meeting.
⚡ AirSaas best practice: Portfolios prioritized once and frozen for 2-3 years are a thing of the past. Today, continuous prioritization is standard practice. An AirSaas survey (2022) shows that most CIOs reprioritize their portfolio at least every quarter, and often every month.
The essential KPIs for portfolio steering
Steering a project portfolio without indicators is like driving without a dashboard. Here are the must-have KPIs, organized into 4 categories.
Strategic alignment KPIs
- % of projects aligned with strategic pillars: every project must be tied to an objective. A healthy portfolio shows 80 to 100% alignment.
- Budget distribution by strategic pillar: visualize whether investments are consistent with the stated priorities.
- Benefits realized: actual value observed after closure, compared with the benefits expected at selection.
Capacity and resource KPIs
- Resource utilization rate: productive time vs total available time. Above 80%, the risk of overload is high.
- Demand vs capacity ratio: how many projects are on hold for lack of bandwidth?
- Productivity per resource: tasks or milestones completed per period, to spot performance gaps.
- Team churn: staff turnover during a project — a leading indicator of management problems or overload.
Operational performance KPIs
- % of projects "on track" / "at risk" / "in alert": the classic health triptych, essential for an effective portfolio review.
- Milestone hit rate: are the key milestones reached on time?
- Budget variance: gap between planned and actual costs — an early warning signal.
- Number of change requests: an indicator of scope stability. A high number signals insufficient initial framing.
- Project health index: a composite score combining cost, schedule and risk into a single indicator.
- Compliance: adherence to current processes, methodologies and regulations.
Value and outcome KPIs
- ROI of delivered projects: is the portfolio actually creating the expected financial value?
- Time to Market: how long between the decision to launch a project and the first delivery of value?
- Cancellation rate: the organization's ability to stop unprofitable projects — a sign of maturity, not failure.
- Stakeholder satisfaction: satisfaction surveys of sponsors, business units and project teams.
- Risk management: ratio of mitigated risks to identified risks — measures the effectiveness of anticipation.
How to choose your PPM tool?
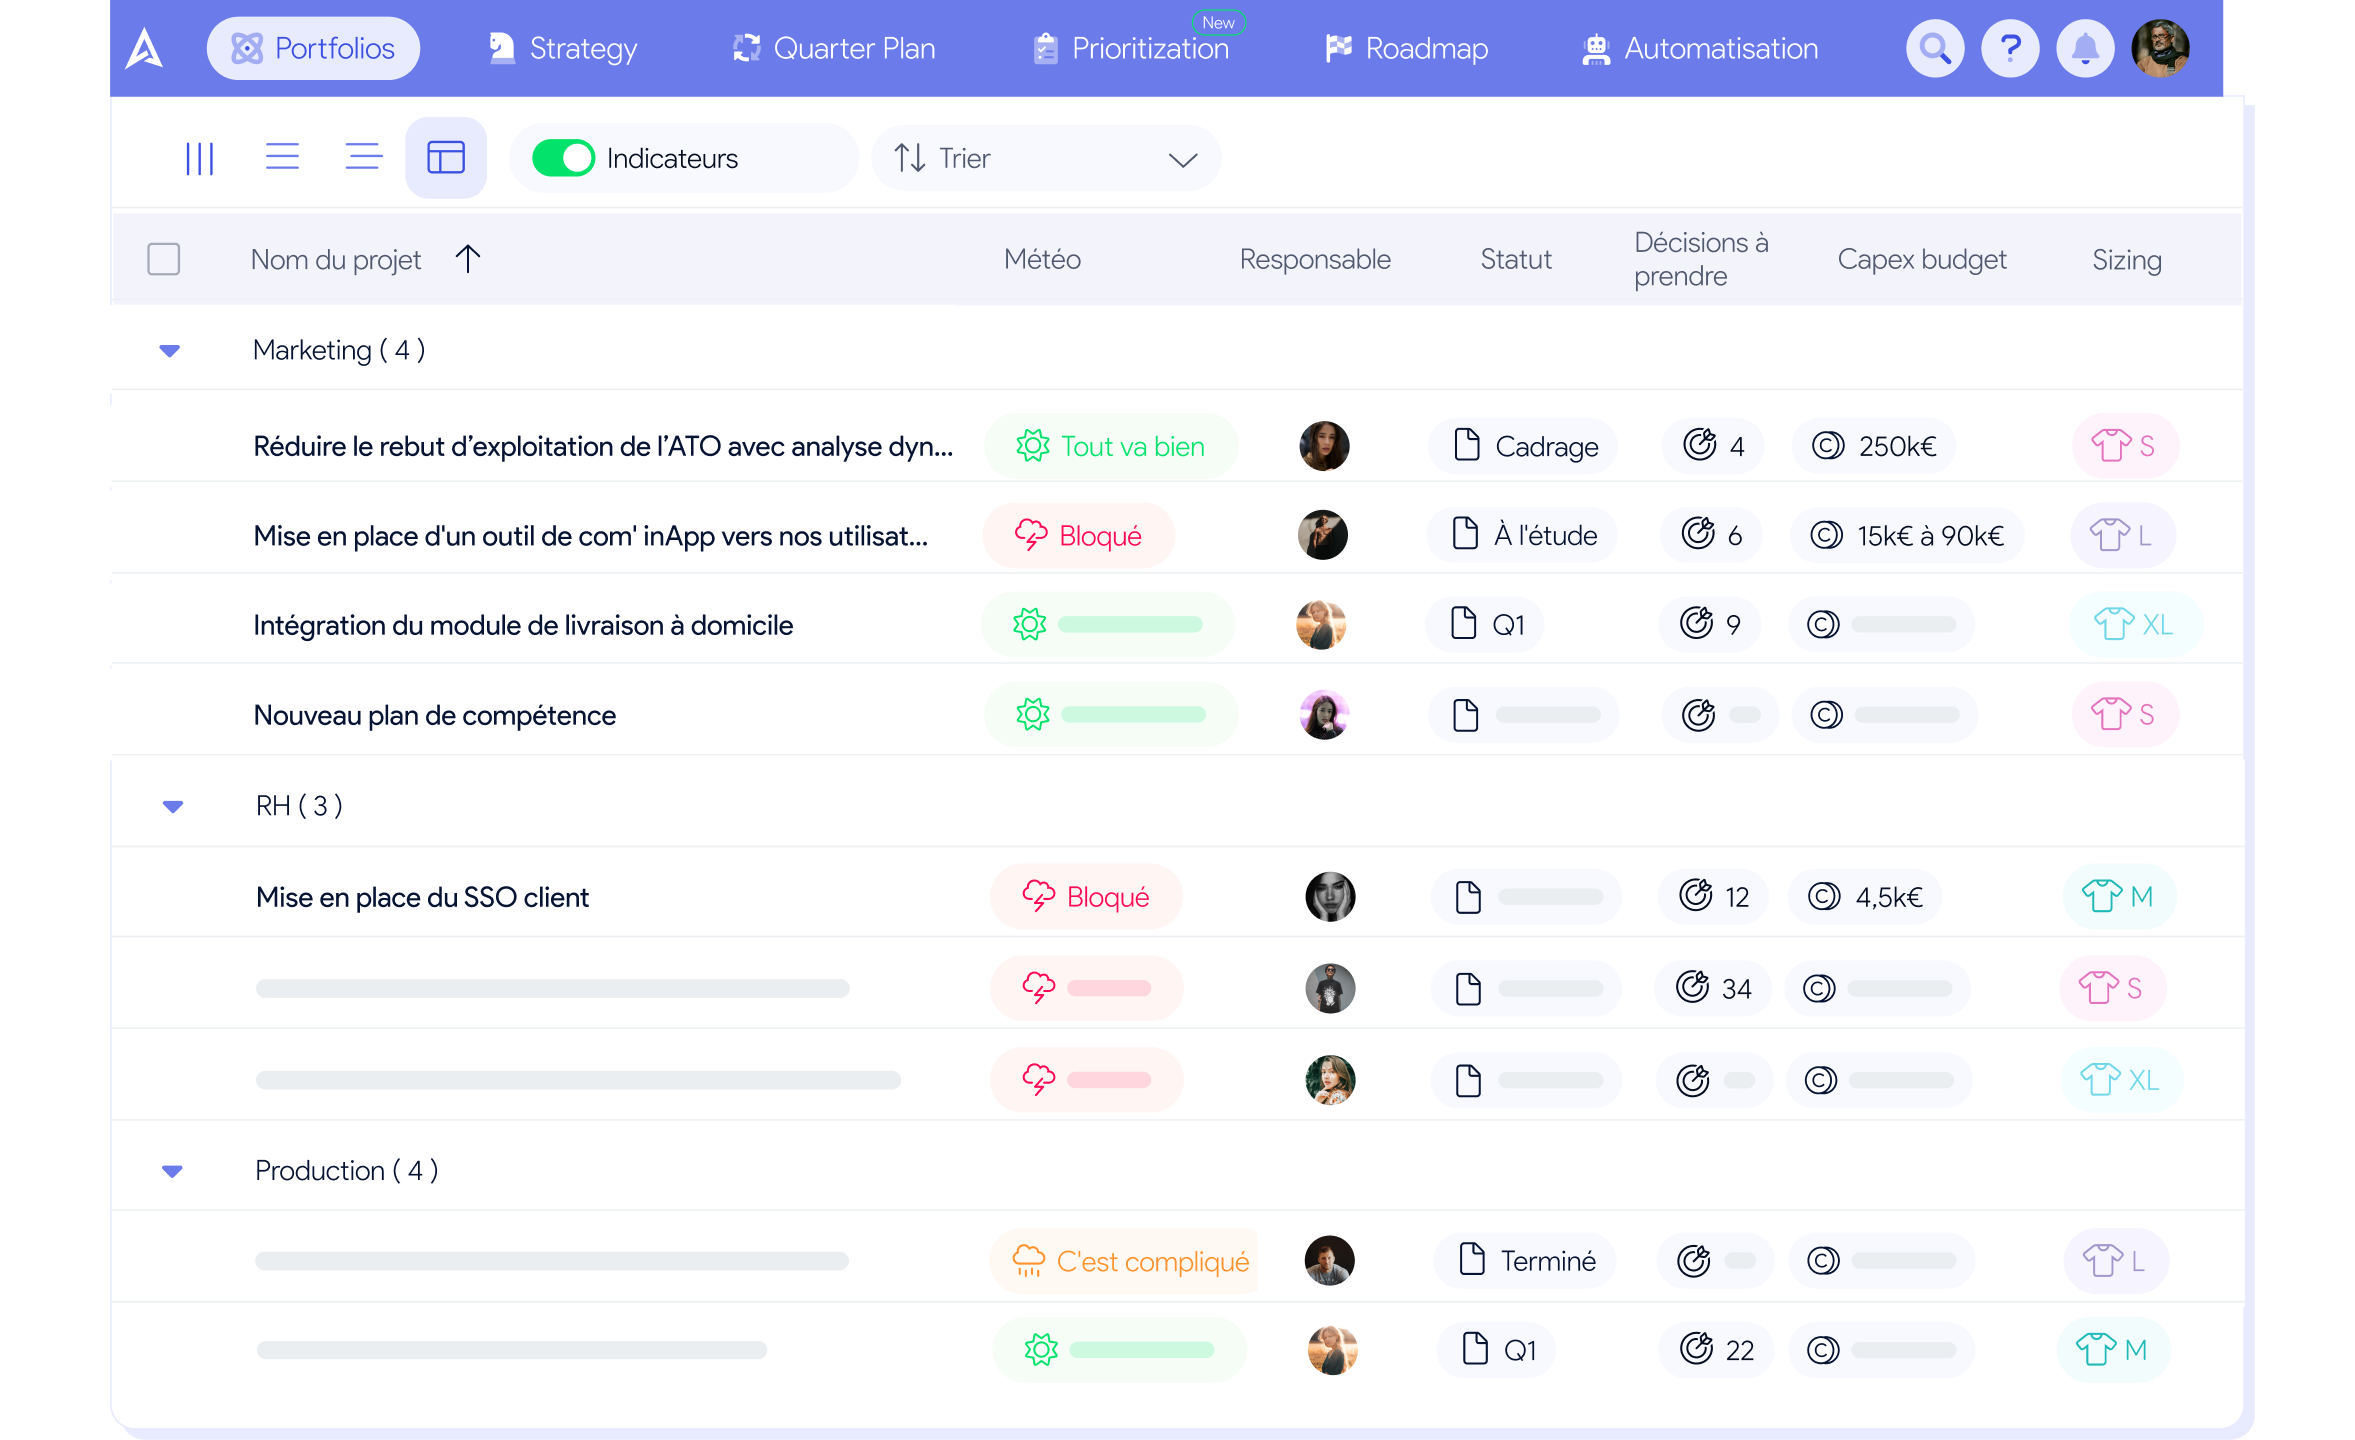
The market for project portfolio management tools has changed considerably. Gone are the ERP/PPM behemoths of the 2010s. Modern solutions bet on simplicity, collaboration and automation.
The essential criteria of a good PPM tool
Ease of adoption: The tool must be usable by project managers, business teams AND leadership, without complex training. If nobody uses it, it is useless.
Consolidated portfolio view: Visual dashboards with filters (by program, by strategic pillar, by project health, by owner). The macro view is the tool's whole reason for being.
Automated reporting: Automatic generation of flash reports (PPT, PDF, URL) for the steering committee, without spending 4 days compiling data by hand.
Ritual management: The tool must structure your portfolio reviews, project check-ins and steering committees with suitable workflows.
Integration with the existing ecosystem: Native connection to task management tools (Jira, Asana, Monday, Azure DevOps) to surface operational data without double entry.
Real-time collaboration: All stakeholders (IT department, business units, leadership) contribute on the same platform. No more "I didn't know".
What a PPM tool won't solve
A tool, however good, cannot compensate for fuzzy governance, undefined strategic objectives or indecisive management. The tool is a catalyst: it amplifies good practices, but does not create them.
Mistakes to avoid in project portfolio management
After hundreds of conversations with CIOs, PMOs and transformation leaders, here are the most frequent mistakes we observe.
Mistake #1 — Confusing portfolio management with project management
The portfolio is not there to micro-manage each project's tasks. It is there to make strategic decisions: which projects to launch, stop, accelerate or postpone. Mixing the levels creates confusion and weighs down governance.
Mistake #2 — Not daring to stop a project
A portfolio that never "kills" a project is a sick portfolio. If a project no longer creates value, has seen its context change or ties up critical resources, you must be able to stop it. That is a sign of maturity, not failure.
Mistake #3 — Underestimating capacity management
Approving 20 projects when you have the capacity to run 8 properly is the recipe for collective failure. And capacity is not managed "globally" — it is managed team by team, quarter by quarter. An organization can have budget available and resources "on paper", but if the Data team is saturated in Q2, no Data project will deliver. The chronic inability to say "no" is the most widespread symptom of PPM-immature organizations. Project portfolio management forces you to confront demand with the reality of each team's capacity — and to own the trade-offs that follow.
Mistake #4 — Trusting the percent complete
Percent complete is one of the most misleading indicators in portfolio steering. A project shown at 70% can be months away from delivering a single usable deliverable. That figure most often measures effort consumed (how many days have been spent) and not proximity to a tangible result. PPM-mature organizations replace percent complete with concrete indicators: milestones reached, deliverables accepted, features shipped to production. The question to ask in a portfolio review is never "what % are we at?", but "what will be delivered and usable by the end of the quarter?"
Mistake #5 — Heterogeneous, time-consuming reporting
If every project manager produces their reporting in a different format, at a random frequency, the steering committee will never get a clear view of the portfolio. Standardize the format, automate collection, set a regular cadence.
Mistake #6 — Launching the approach without sponsorship
Project portfolio management touches budgets, priorities and sometimes power games. Without a sponsor at executive leadership or CIO level, the approach runs out of steam at the first difficult trade-offs.
Mistake #7 — Trying to do everything at once
Favor a progressive approach: start with a limited scope, simple rituals and a small number of pilot projects. Show the first results, then expand. Adoption happens through proof, not decree.
Frequently asked questions
A project portfolio is the set of an organization's projects, programs and operations, managed collectively to achieve strategic objectives. Wikipedia defines it as "the discipline of looking at projects from a global standpoint for the purposes of selection and trade-off" (Fernez-Walch, 2004).
Multi-project management is operational: it aims to run several projects in parallel efficiently (planning, resources, dependencies). Portfolio management is strategic: it decides which projects to launch and in what order, based on their contribution to the strategy. In short, multi-project management handles the "how", the portfolio handles the "what".
Generally, it is the PMO (Project Management Office), the CIO or the Chief Transformation Officer who steers portfolio management. But trade-off decisions involve executive leadership and business units. Project portfolio management is by nature cross-functional and collaborative.
A project management tool (Jira, Asana, Monday, Trello) manages the tasks, schedule and resources of an individual project. A PPM tool steers the whole portfolio: consolidated view, trade-offs, strategic reporting, alignment with objectives. The two are complementary and should ideally be connected.
Absolutely. Company size does not determine the need — what counts is the number of projects competing for the same resources. As soon as an SME runs more than 5-10 cross-functional projects in parallel, a portfolio approach — even a light one — brings considerable value. SMEs often have more agility to implement it, too.
Continuous prioritization has become the dominant practice. Most mature organizations hold a formal portfolio review every month, with ad-hoc trade-off points when the context demands it. Roadmaps frozen for 2-3 years have given way to agile, adaptive steering.
The most recognized frameworks are: the PMI's Standard for Portfolio Management, MoP (Management of Portfolios) from AXELOS, Lean Portfolio Management (LPM) from the SAFe framework, and approaches inspired by OKRs (Objectives and Key Results). The choice depends on your organization's culture and maturity.
What if you took back control of your project portfolio?
Book a demo and discover the tool in 30 minutes.