The modern project management dashboard
modern
Already adopted by 100+ CIOs of mid-market companies and large groups
Kiabi · Valrhona · Leroy Merlin
 ISO 27001
Like any executive team, the IT Department has a constant need to measure its activity: only in this way can it optimize each of its project management processes, and reduce the number of slippages with serious negative consequences for the customer (cost overruns, project delivery deadlines...). Measuring performance through indicators enables you to fine-tune the changes you need to implement in order to boost your departments' productivity, and to execute even more ambitious projects. Measuring and monitoring key indicators then enables improvements, optimizations and the implementation of ambitious steering strategies with general management. Readthe complete guide to project management.
AirSaas, the project management dashboard built for CIOs
Innovation is becoming increasingly important for companies:digital projectsare multiplying, and their success is becoming a prerequisite for an organization's competitiveness. As a result, companies are placing ever-increasing demands on CIOs, who often find themselves at the heart of new strategies. Our project management dashboard has been designed to enable IT Departments to respond to business needs, and to collaborate closely with business units.
Steering by value
One of the keys to ensure the sustainability of your company is to know how to prioritize projects in order to prioritize those that will create the most value. If the IT department wants to be efficient, it must createindicatorsthat will enable management to make the best decisions and ensure optimal management of IT projects.
To do this, you need to be able to effectively keep board members informed. A project management dashboard with indicators that provide visibility in three of the main areas isthe ideal toolfor this, enabling you to:
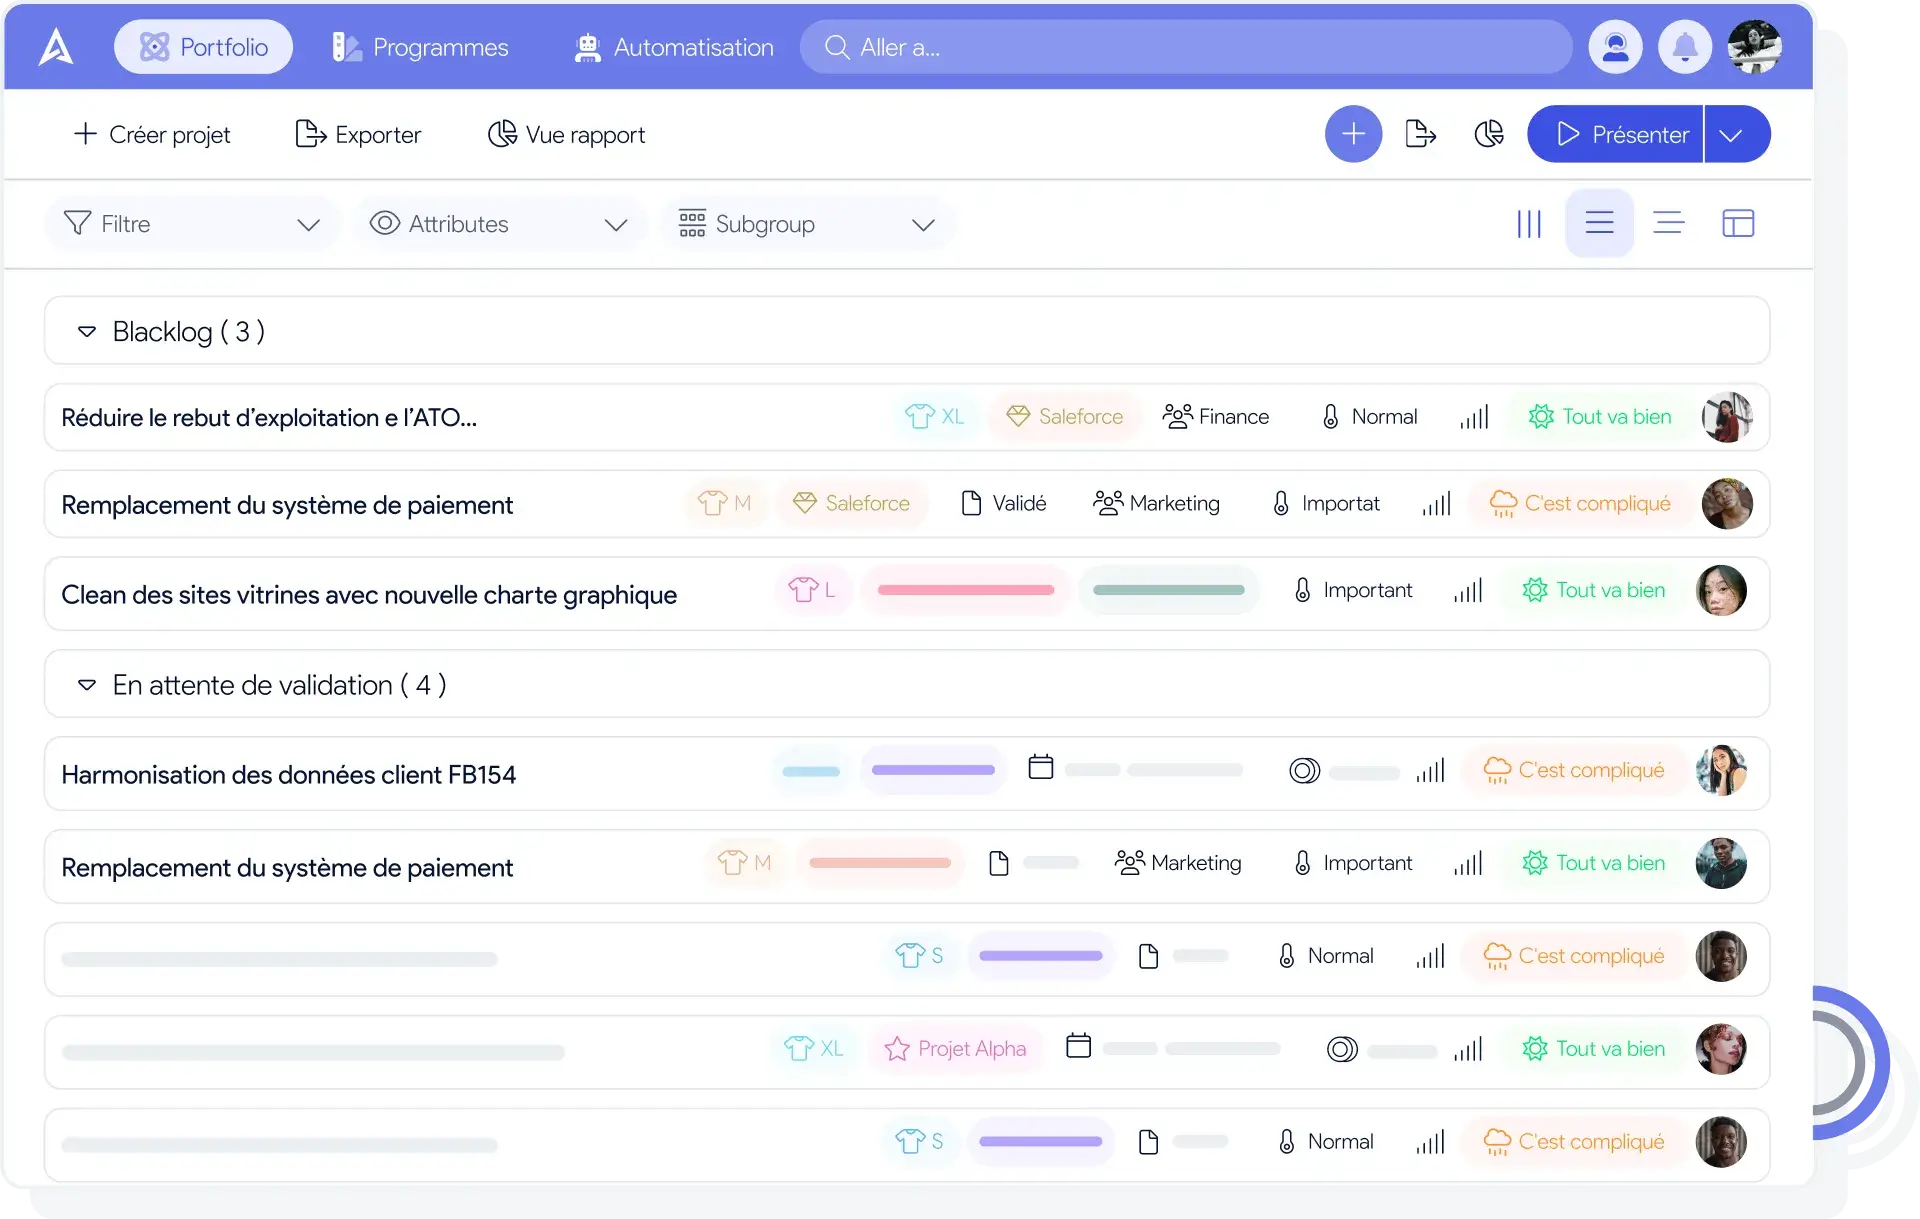
AirSaas offers 3 views for total visibility over your projects:
Monitoring the progress of each of your projects, with the most important indicators. So you always know what the next step is to make your projects evolve.
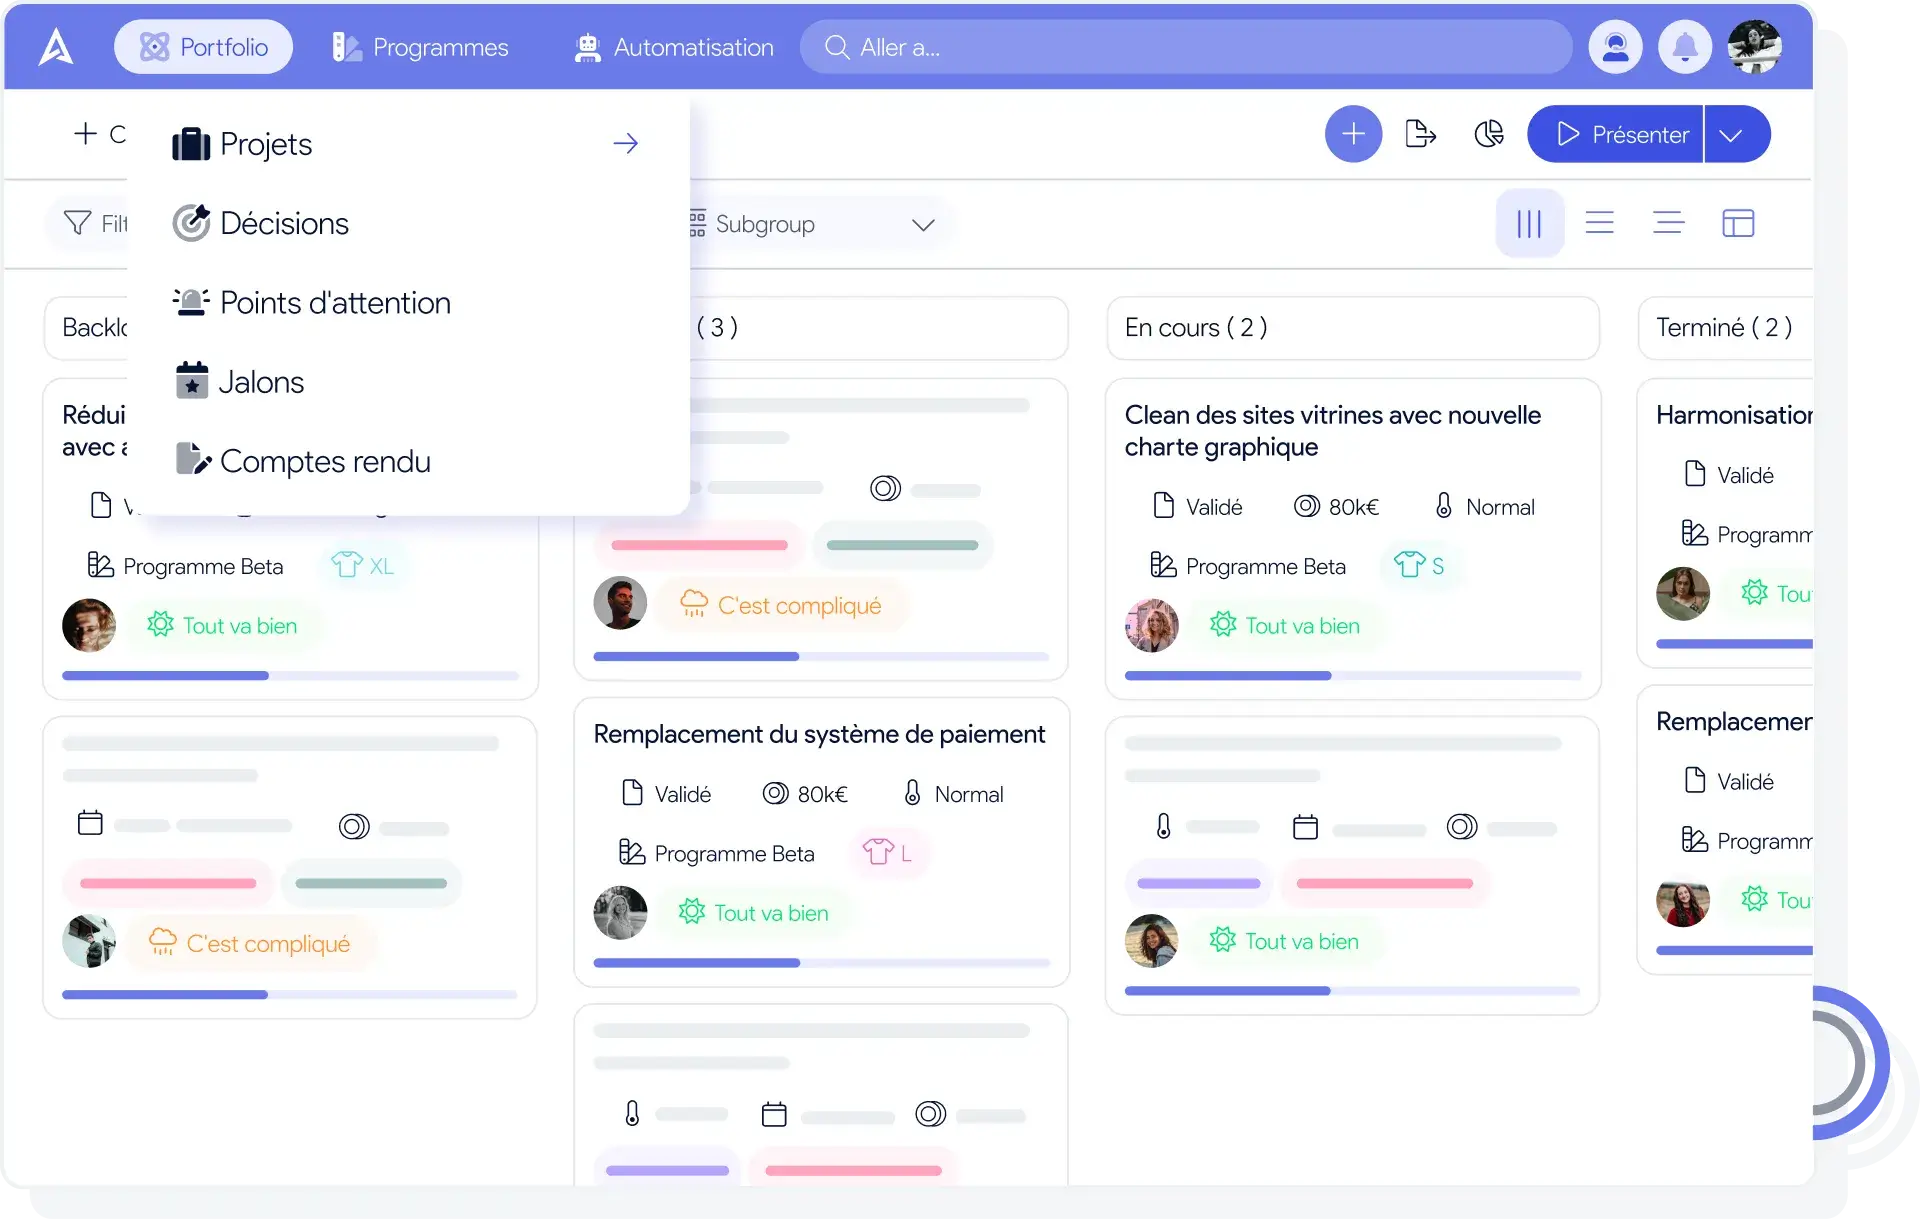
Kanban view
A Kanban view that helps to identify general trends among your projects in order to optimize your management strategy.
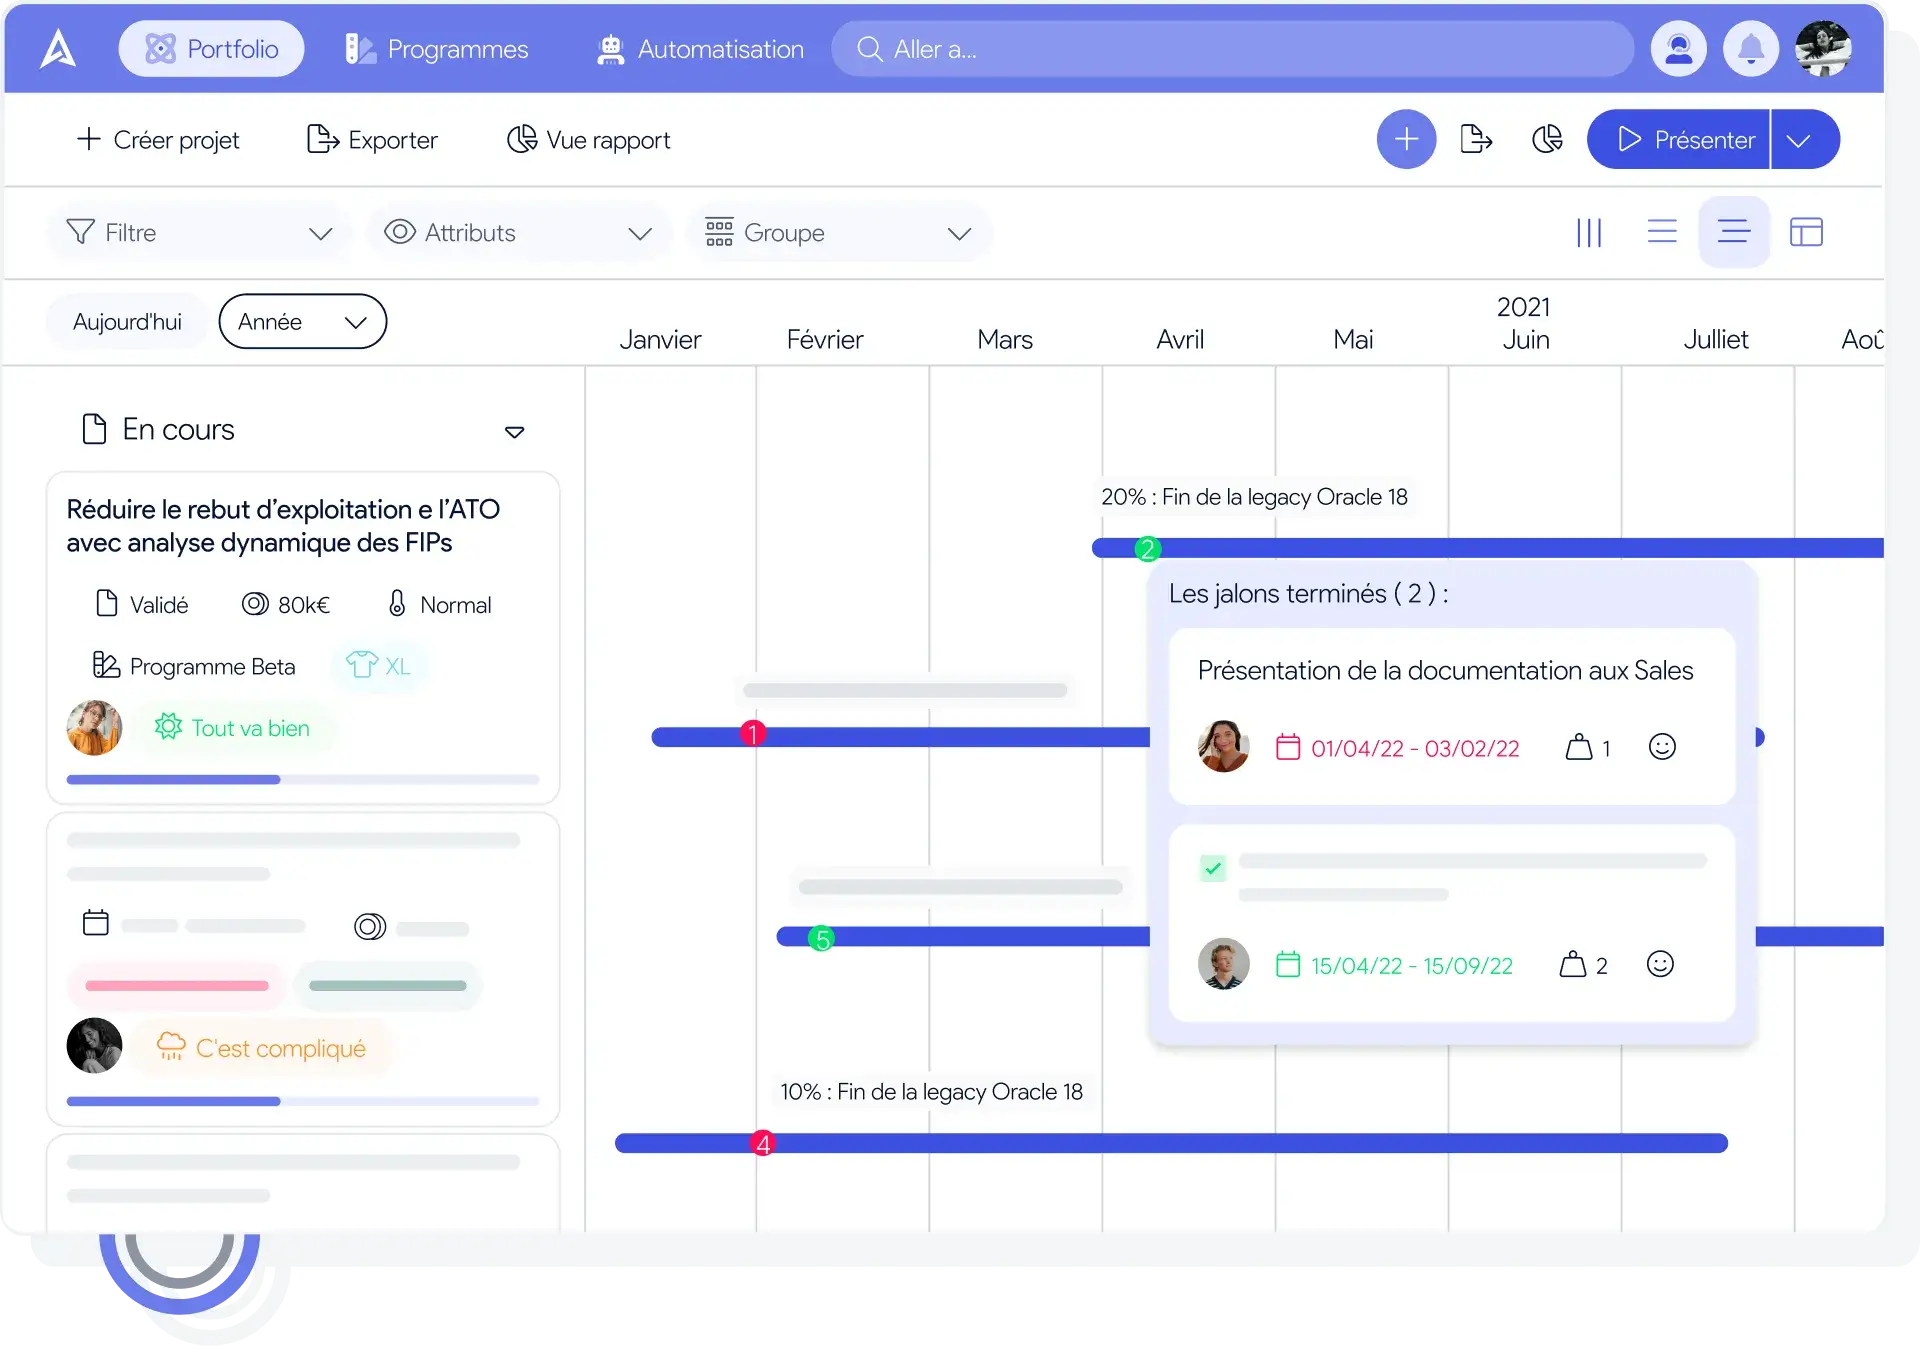
Timeline view
A timeline view to organize the execution of all your projects over the long term. It makes it possible to identify overloads of work in advance and to anticipate delays.
You can filter these views according to different indicators: their importance to the company, the project's timeframe, the teams working on it, the goals assigned to it, etc. AirSaas thus simplifies the management of your resources and budgets: you can create different scenarios, plan the execution of several projects, and observe their impact on your performance. In this way, you can allocate your workforce optimally.
Involve every stakeholder
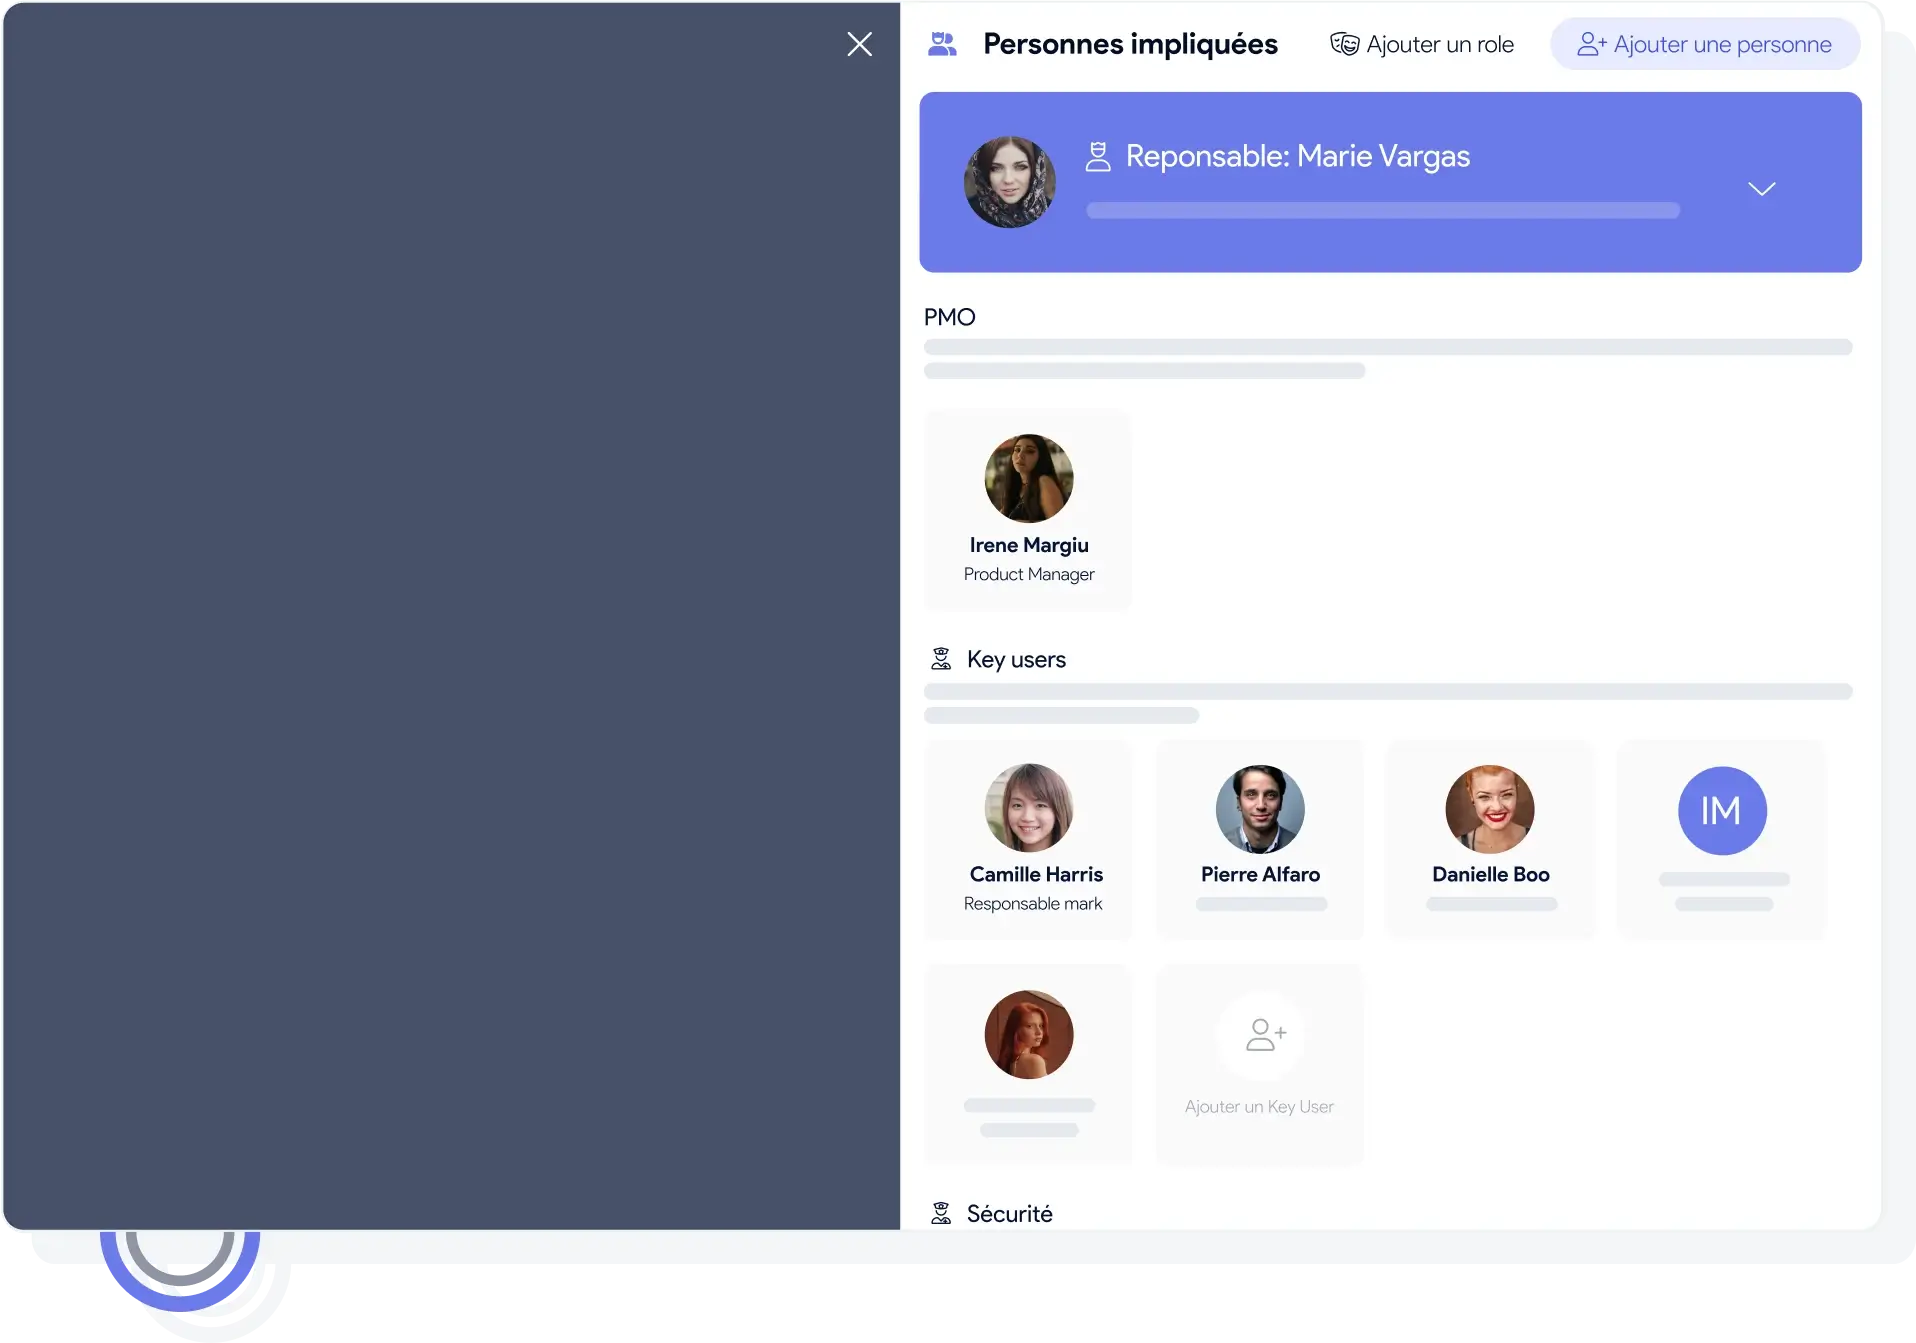
The supreme objective is to succeed in delivering a project that perfectly satisfies your client while respecting the expected deadlines. One of the main factors in achieving this is to involve your client from the scoping phase, and throughout the execution of the project. Likewise, you must also be constantly in a position to inform your management of the progress and status of all your projects, in order to enable them to better manage the company.steer the company as well as possible.
Choose to gain time and controltime and control
Adopt an effective project flash report solution today
The automated The automated flash report
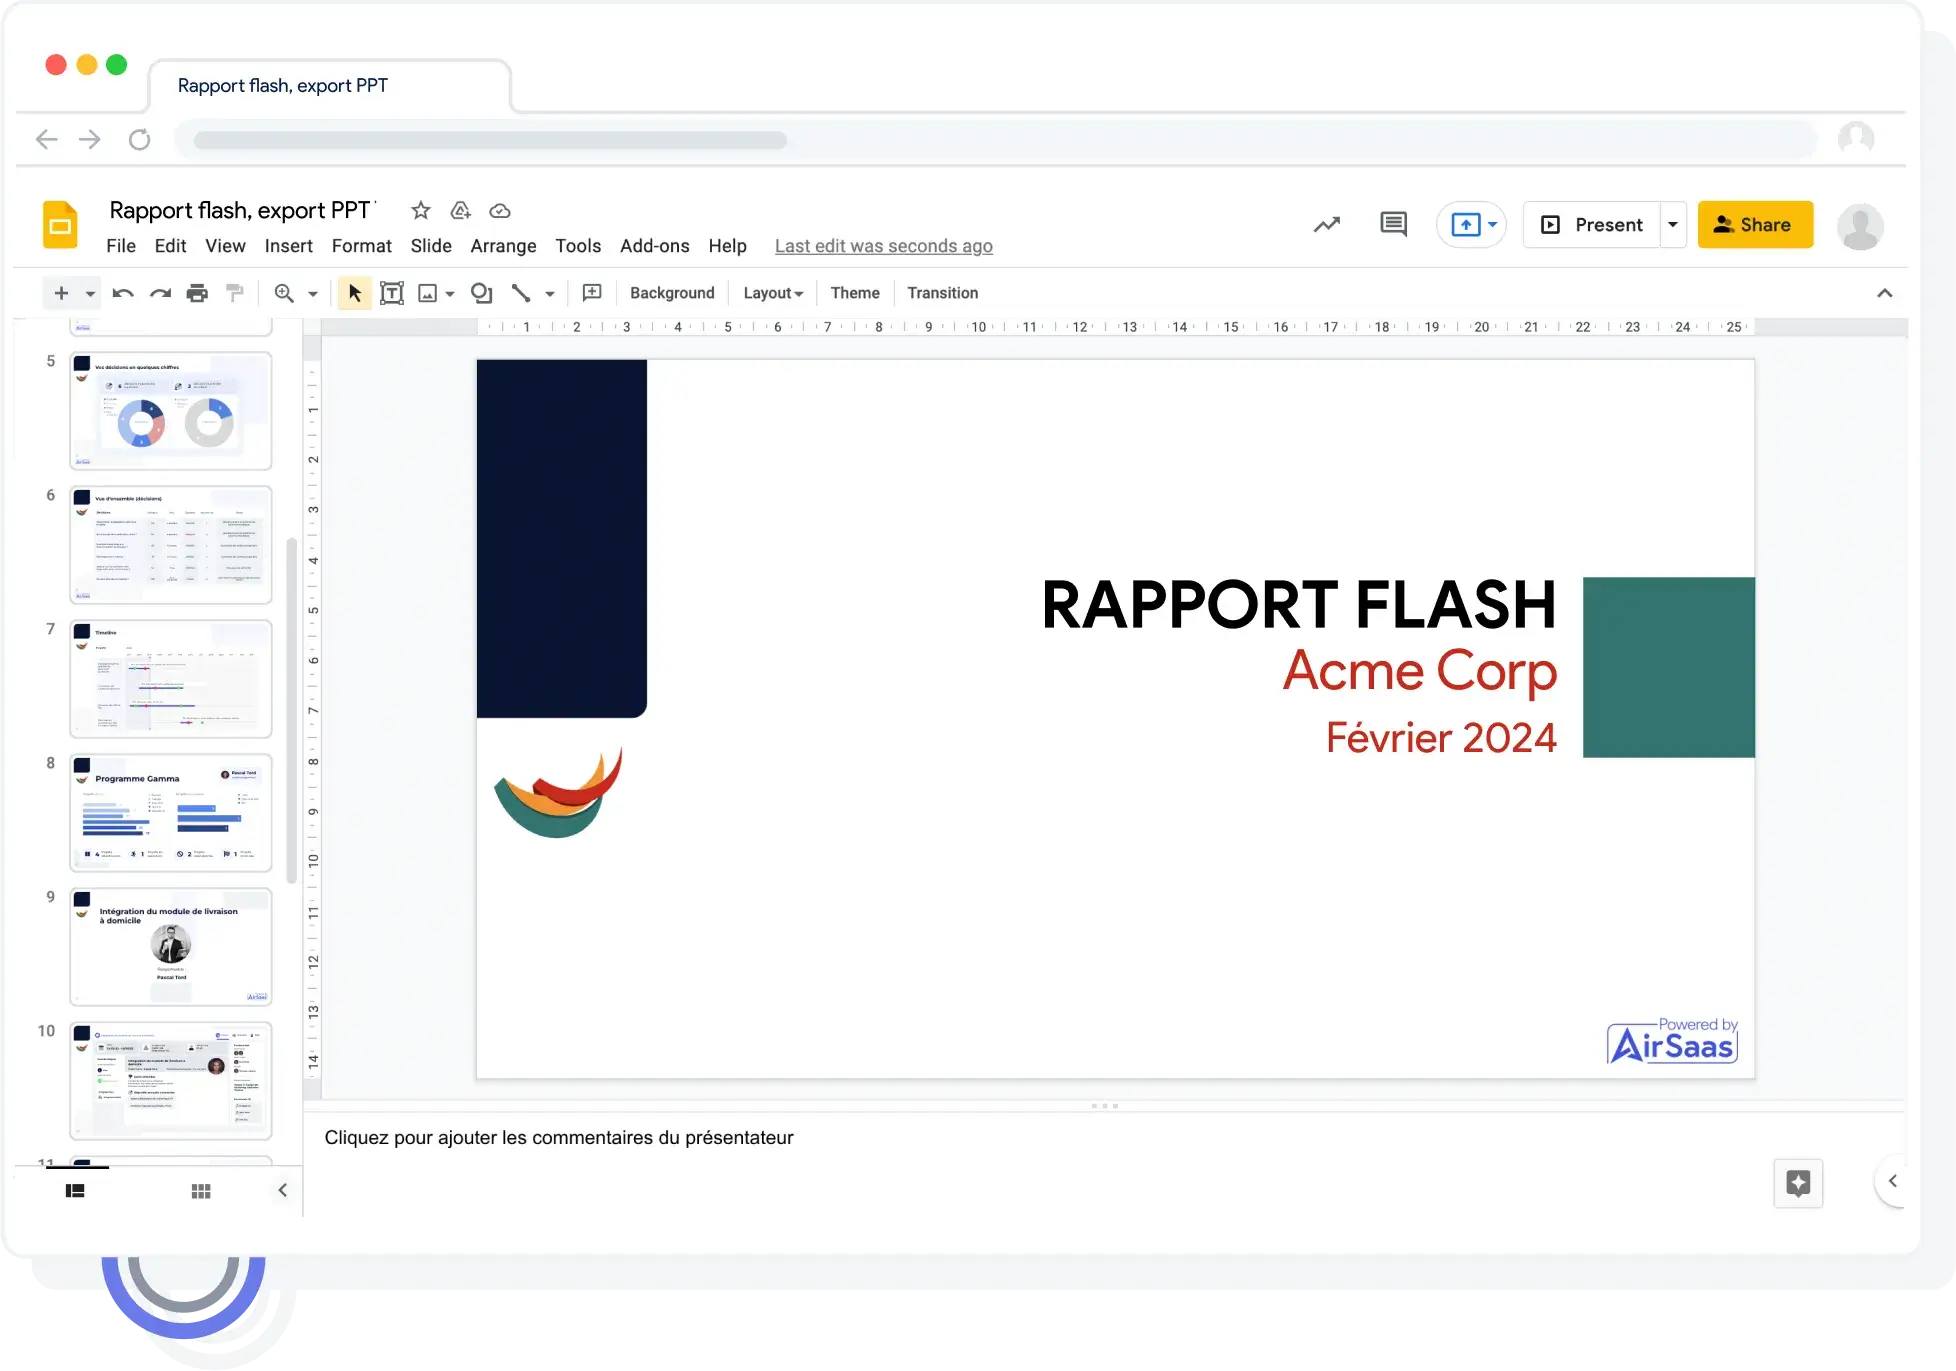
While reporting is essential for the smooth running of a project, it is too often neglected, in particular because it requires a lot of time. That's why we offer you the possibility to automatically generate flash reports. Exportable in PDF or PowerPoint format, they allow you to communicate your progress to all the parties involved in your projects. The flash reportis composed of two slides: one summarizes all the framing information, while the other contains all the information necessary for the successful execution of the project.
Survey your teams with the commitment indicator
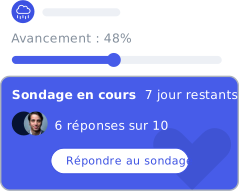
The chances of a project's success increase when its stakeholders have confidence in its execution. We created an anonymous survey tool so that you can know how confident each party is in your projects. In this way, you will have the ability to react in time in order to avoid delivering a product that is too far from your customer's expectations. You can send this survey to everyone involved in your project in under a minute. Regularly assessing their level of trust will allow you to ensure a result that meets everyone's expectations.
Project management dashboard: why does it matter so much to an IT department?
As digital technology develops, CIOs are more and more likely to be given missions that touch on the heart of their company's business: the information system is now considered to be one of the key factors in creating value.
If an IT department wants to support the growth of its company, it has to manage the execution of its projects in the best possible way. And it is precisely here that the project managementdashboardquickly becomes essential for effective management of an IT department.
If you want to improve your processes, you must first be able to evaluate your current practices: this is the best way to find out whether the methods implemented are effective and enable you to achieve your goals. A project dashboard therefore enables you to manage the operational aspects of IT projects, in both the short and long term, but also:
How do you choose the right indicators for your project dashboard?
A few principles to respect for sound portfolio management
It is important to follow certain formal rules when developing indicators, in order to ensure that they are relevant:
Build your project dashboard indicators around your organization's ambitions
There are dashboards whose choice of relevant indicators has already been thought out, and which are intended to be able to adapt to all, or at least to a large number of companies. However, taking the time to develop indicators customized to your organization remains the best solution.
Each company has different goals and its own characteristics. Using a universal dashboard template can therefore only be of limited effectiveness. On the other hand, a project management dashboard with indicators designed according to the ambitions of a company will necessarily be more effective in supporting the management of an IT department. But building criteria taking into account the context of the company (its employees, the projects carried out, the results desired) is time-consuming and complex. Indeed, it requires in-depth knowledge of each of the organization's activities. Therefore, we strongly recommend involving business managers in the development of the dashboard and its indicators.
Bring the business units into building the dashboard indicators
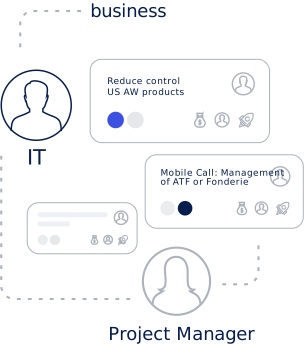
It is not uncommon for business departments to be asked very little in the development of CIO dashboards. However, it is the professions that are the recipients and users of the vast majority of the solutions on which IT teams work!
Involving the business departments in the construction and implementation of the indicators on your dashboards allows you to judge the progress of your projects according to the criteria that matter to the end customer. This is therefore the best way to check that the delivered product fully satisfies its users. Therefore, we recommend creating these indicators by forming working groups made up of business managers and members of your IT department.
To close, here are the two main rules for building dashboard indicators that will lift your performance:
By following these principles, you maximize your chances of creating a dashboard that truly simplifies the management of your IT department.
Companies are placing ever greater importance on innovation: digital projects are multiplying and their success has become a prerequisite for the organization's competitiveness. As a result, companies have increasingly high expectations of CIOs, who often find themselves at the heart of new strategies.
Our project management dashboard was created to enable the IT Department to respond to the needs of the company and to collaborate closely with the various departments.