November 30, 20239 min readJérôme Dard
All you need to know about PMO reporting

Contents
PMO reporting is not a task that should be taken lightly: sharing a common understanding of the project portfolio's health status and challenges with all stakeholders can change an organization's dynamics! The importance of project dashboards and performance indicators within organizations is well-established.
However, in project management, reporting is sometimes perceived negatively by project managers and PMOs!
Do you see it more as a chosen decision-making tool or as an instrument of managerial control that you simply "endure"?
If you think this communication tool and the processes around it are sometimes misunderstood, you're in the right place to better understand its value, spot the best PPM practices and simply improve how you use reporting today.
After a (always useful!) definition, this article will cover the role of data in decision-making, its purpose, uses, pitfalls to avoid, PMO processes and methods, cadence, the people concerned and stakeholders... Everything you need to take on the major challenges of putting this practice in place and succeed at managing your portfolios.
What is a project report, and why is it so important to do it (well)?
What is project reporting?
Our favorite online encyclopedia reminds us: "A report is a document that presents information in an organized format for a specific audience and purpose."
As a communication tool, reporting essentially makes it possible to materialize the data from your project portfolio. It is one of the PMO's key management tools.
And on top of that, effective PMO reporting = the key to leadership in the management committee.
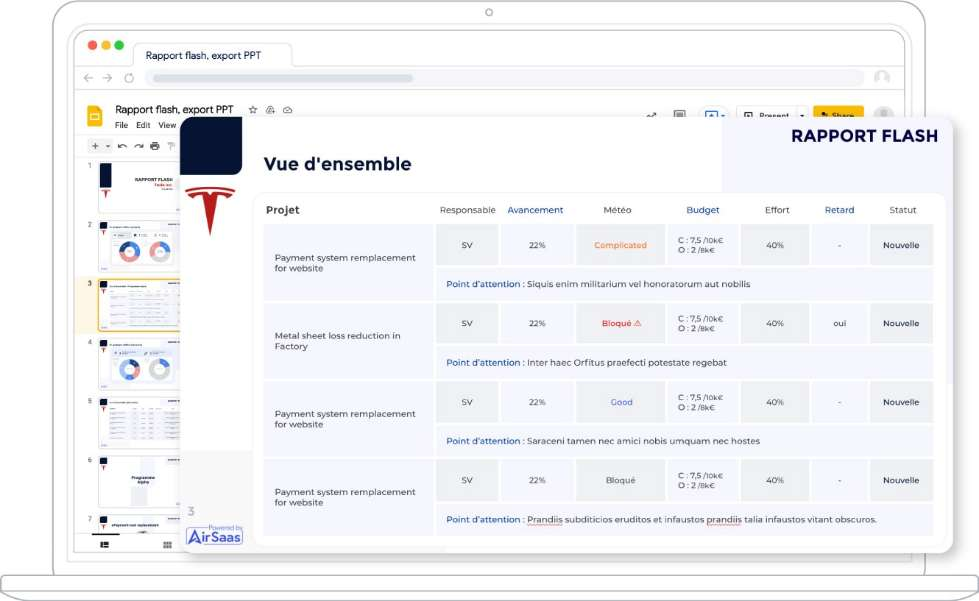
Example of an AirSaas Flash Report
A PMO report: what's it for?
This reminder is fundamental. Reporting has two main functions:
- being analyzed in order to guide strategic decisions;
- guiding managers and their teams toward the goals set beforehand.
Reports are vital for every organization; they let us pass on information, identify a problem and help build future forecasts.
Especially in a context where the number of cross-functional and transformation projects is exploding!
By relying on operational performance indicators (also called KPIs, for Key Performance Indicators), you can effectively measure and steer the trajectory of an initiative, or conversely become aware of certain bottlenecks.
A good PMO report should let everyone quickly discern the current state of the environment of each project in the portfolio. Decision-makers in particular must see at a glance what needs to be decided. This seems obvious... but you can quickly trip over an excess of poorly presented information.
Because reporting is above all a decision-making tool rather than the control tool it's often thought to be. It should lead stakeholders to ask themselves questions: "What's the next step for the project?"; "What skills do we need?", "Why did we fall behind schedule on this specific point?". "Why is the delivery pace starting to drop?"
How to succeed at your PMO reporting?
The 7 initial questions to ask yourself
Question 1: What is my goal with these reports?
What do I want to monitor and control? In any case, a project report is ultimately about action, task planning and decision-making. To achieve this, the best project reports all have one thing in common: they let the reader visualize the information at a glance so that everyone, at their level in the company, can make the right choices.
The PMO must guarantee the quality of reports by making sure the data is up to date, accurate and reliable.
Question 2: Who will be making decisions based on these reports?
Your reports are meant to be read! Mapping out your readers is a worthwhile investment. There will indeed be X target formats, X different views of the portfolio.
This second question means identifying the confidentiality levels: restricted, broad, or public distribution.
Question 3: Were future readers involved in building the report?
For them, is this reporting seen as management surveillance or as a tool that supports steering?
After the first report, were they asked whether they were satisfied with the format, the cadence, the visibility?
Will they be able to interact with, edit or comment on the content?
Question 4: What data do I need for this?
Depending on your main personas and readers, you'll have as many reading levels and reporting cadences as needed. Here's an example: a typical reporting content for C-level executives
- Backlog
- Risks
- Resources
- Workload
- Decisions
Rather than reinventing the wheel on this point, rely on the smart frameworks offered by tools with ready-made project management dashboards, like AirSaas.
Another point: data is good, but data with context is even better!
Another key point about the form and the information design beyond raw data: getting the message across also runs through context - adding a comment, a caption... Behind every change in a project's health status, for example, you should be able to easily access the detail.
Question 5: What level of detail is the most appropriate?
"Everything is poison, nothing is poison, it is the dose that makes the poison" (Paracelsus, physician and alchemist)
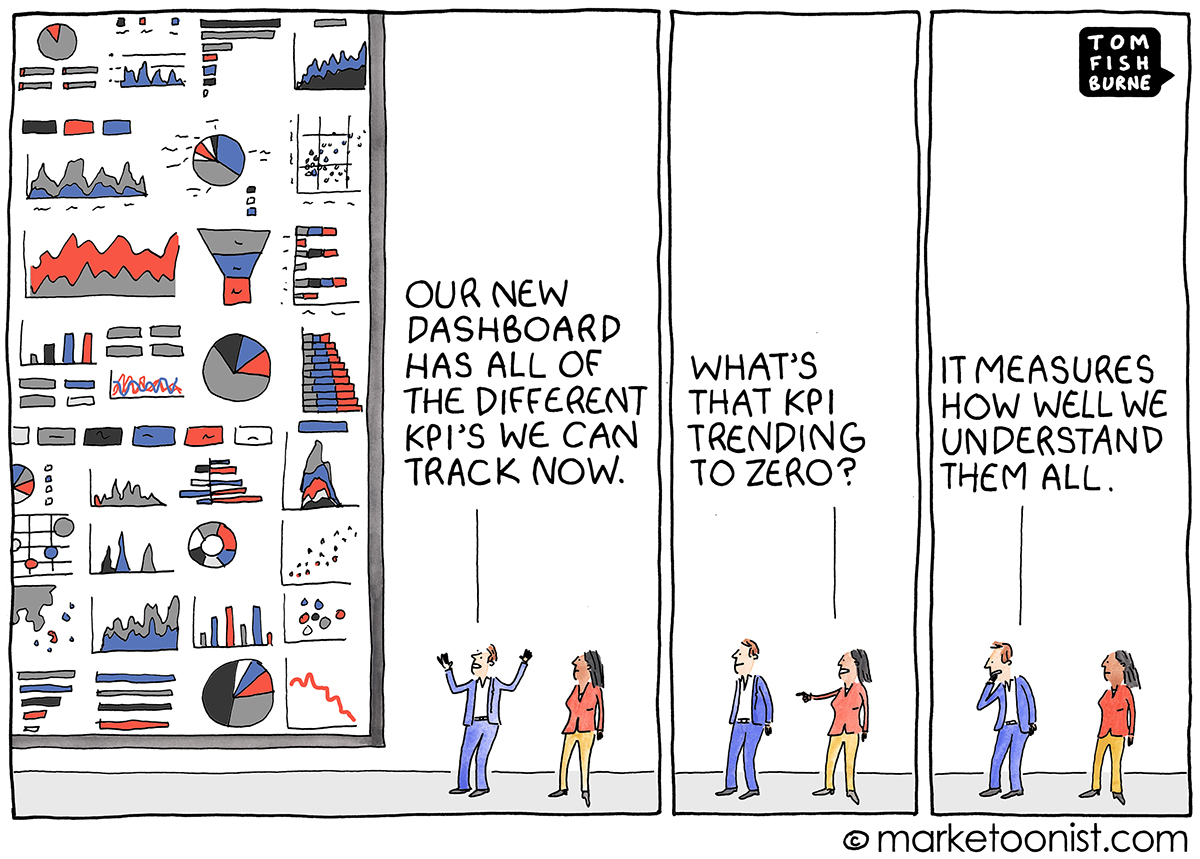
Yes, as opposed to excessive data-driven approaches, minimalist reporting is on the rise.
Four examples of views for your reporting
"Form is the substance rising to the surface" - Victor Hugo.
The importance of design no longer needs proving, both to make collection easier and to build understanding.
"If it's more complicated than Instagram, we've lost!", says Simon Vacher, CPO of AirSaas. Indeed, the tool has to be adopted by the project manager, the PMO, the business units, the leaders...
At AirSaas we offer four types of views.
The Table view, or Spreadsheet view
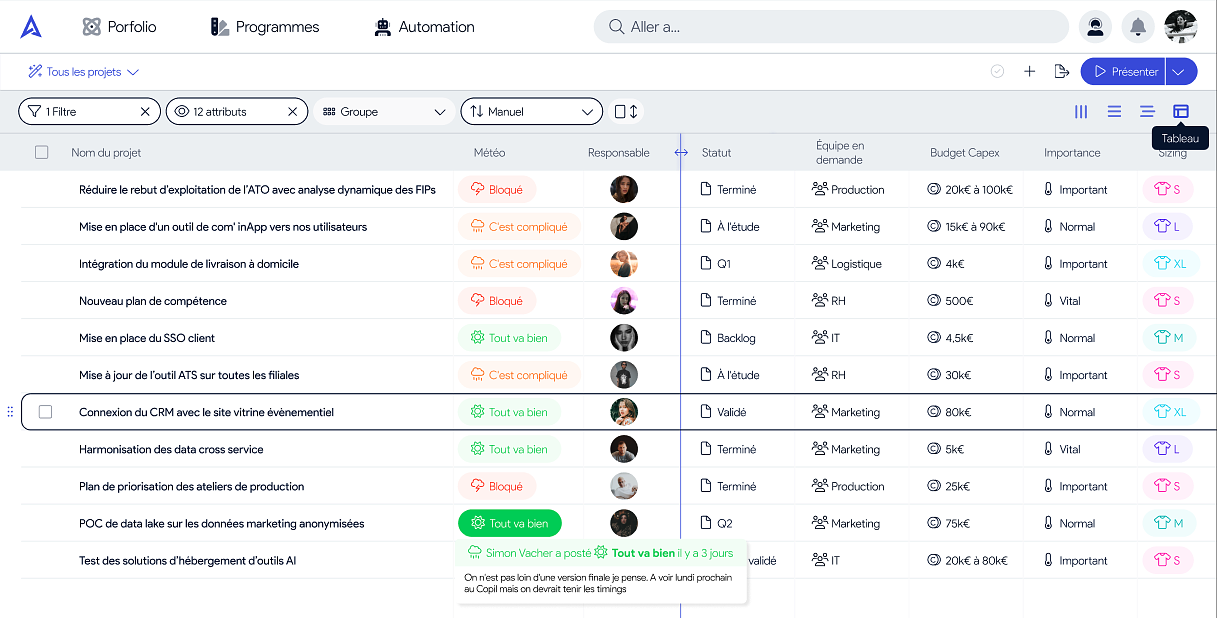
This view is useful for:
- seeing as much as possible on your current page
- arranging the order of the columns relative to one another
- sorting the order of projects manually with drag and drop
- choosing the columns you want to display
The Timeline view, to see the distribution over time
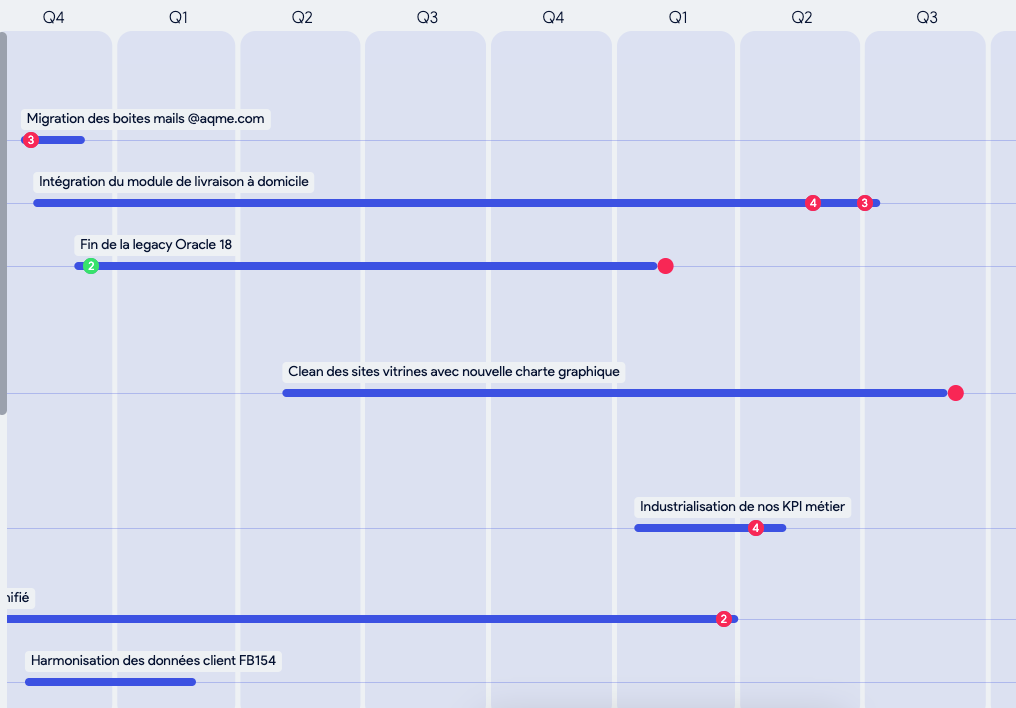
Far more than a simple Gantt chart. The chronological view gives you great flexibility to define the scope of your projects, adjust deadlines and customize your processes.
The Kanban view, to show a transition between stages
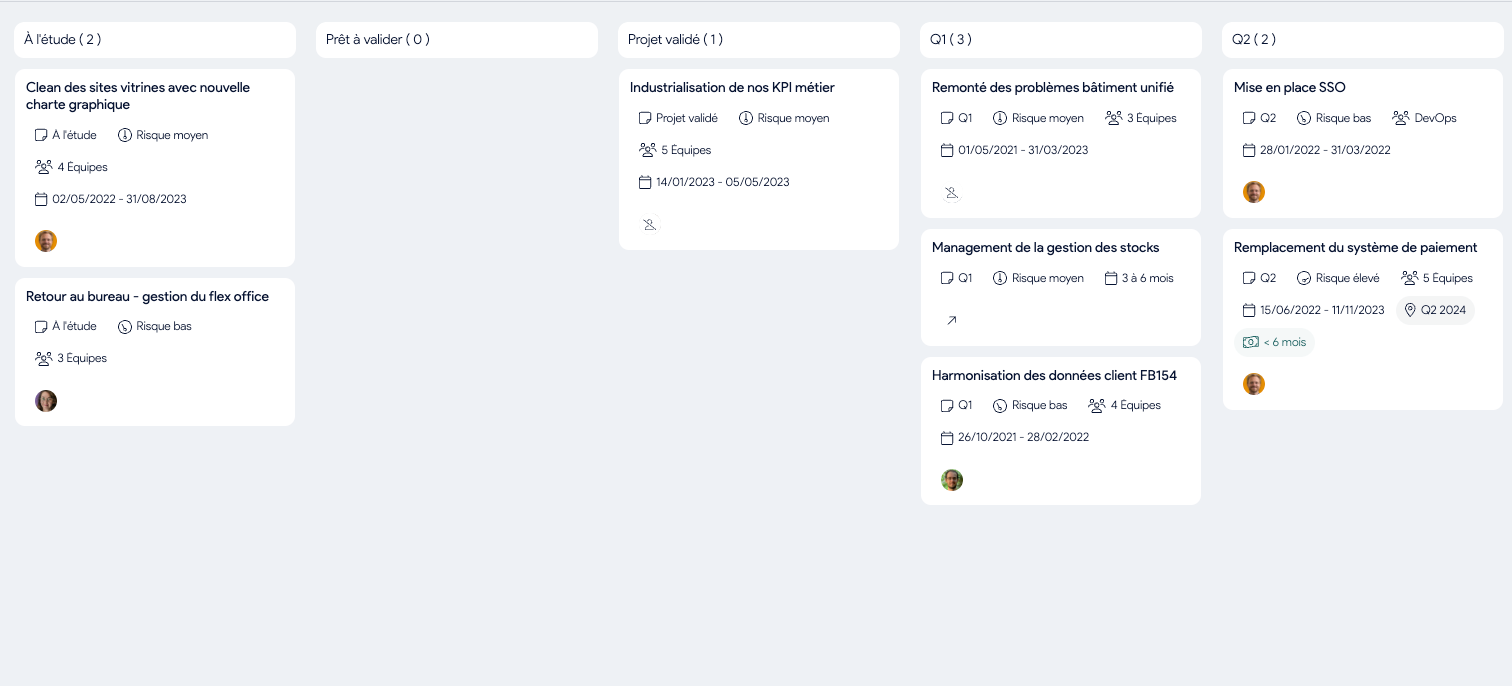
Used in this context, your portfolio's Kanban helps you visually manage projects and their various phases.
The List view
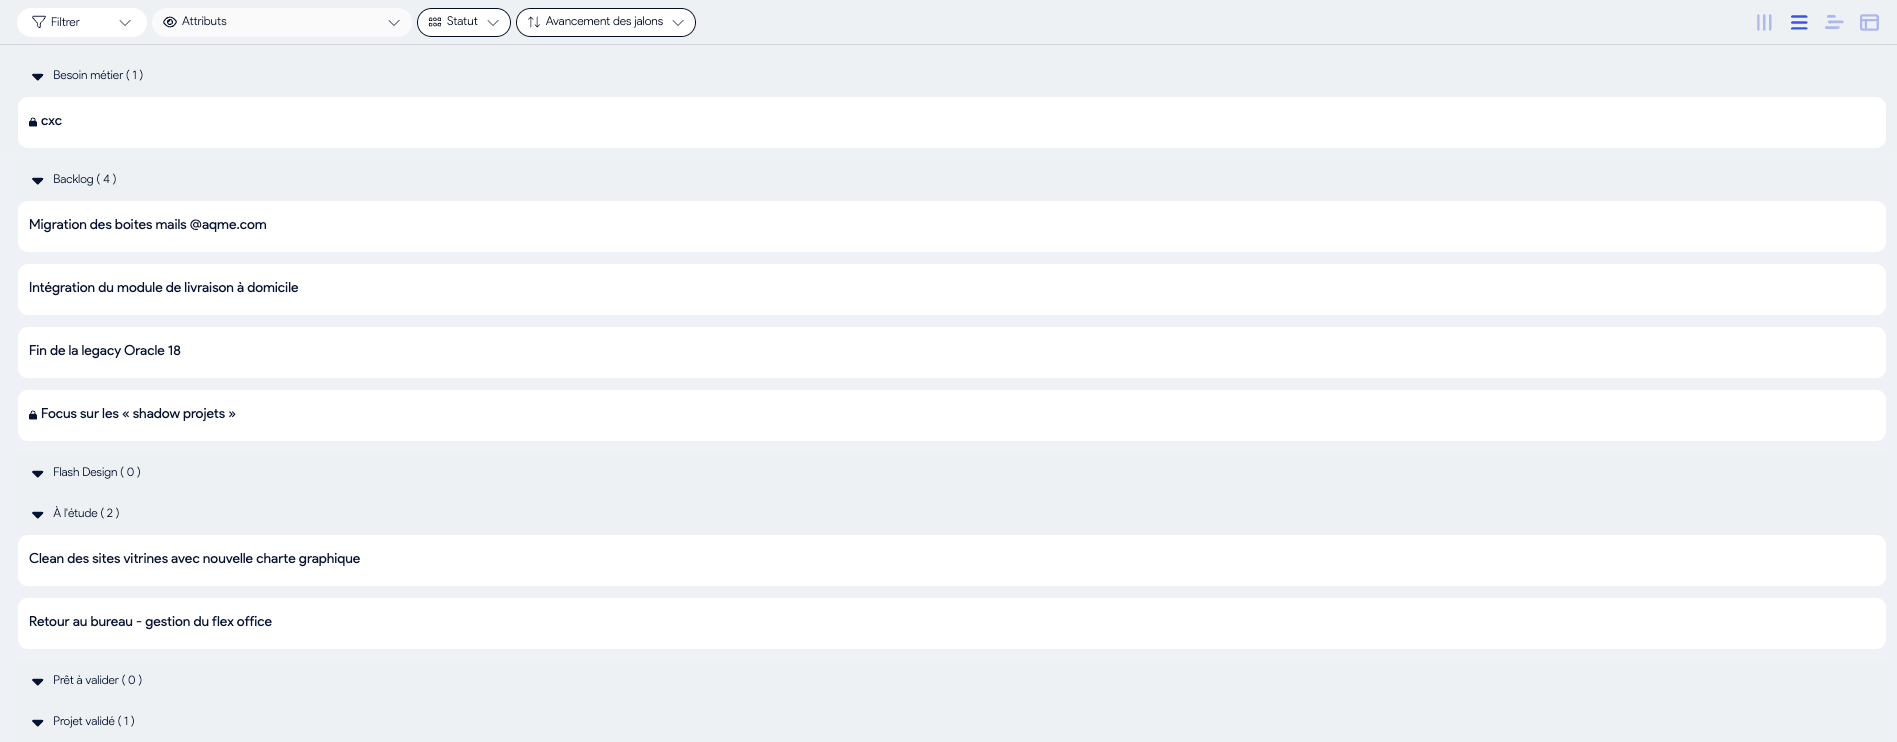
In the portfolio context, the list view is useful for focusing on a set of items within a group.
9 key criteria for effective PMO reporting
- Semi-automated, with automated project-reporting features.
- Adaptable display, from smartphone to large screen.
- Exportable data (XLS, PPT..)
- Printable: sometimes analysis is easier on paper
- Filterable, sortable: your tool must let you sort all your data according to your audiences
- Pleasant: no, that's not the case for every tool, and yes, it's a key detail for adoption
- Authentic / Transparent: if the data is dressed up, you won't get far!
- Concise, with access to the detail and context of the data entries (that's the key)
- A modern report must capture its reader's attention: relevance, good presentation, standardized formatting... everything needed to draw conclusions from it.
When? What frequency should you adopt? What production time?
Hourly, daily, weekly, monthly - there's no universal answer to this question... but there are best practices depending on the types of project in your portfolio.
For a long time, the practice of PMOs within companies was to provide a monthly report in PowerPoint format.
The problem: a project report you receive every two months doesn't let you make quick trade-offs and mitigate risks fast.
Today, keep in mind that "over-performing" organizations offer "on-demand" reporting. For critical-path projects, a weekly frequency tends to become the minimum.
Teams that use AirSaas send the flash report to the various stakeholders once a week. (Yes, really - not once a month...)
"The key is to provide relevant information and have the means to keep it alive continuously, because you don't need to wait for a management committee or a project committee to meet in order to communicate about what's happening."
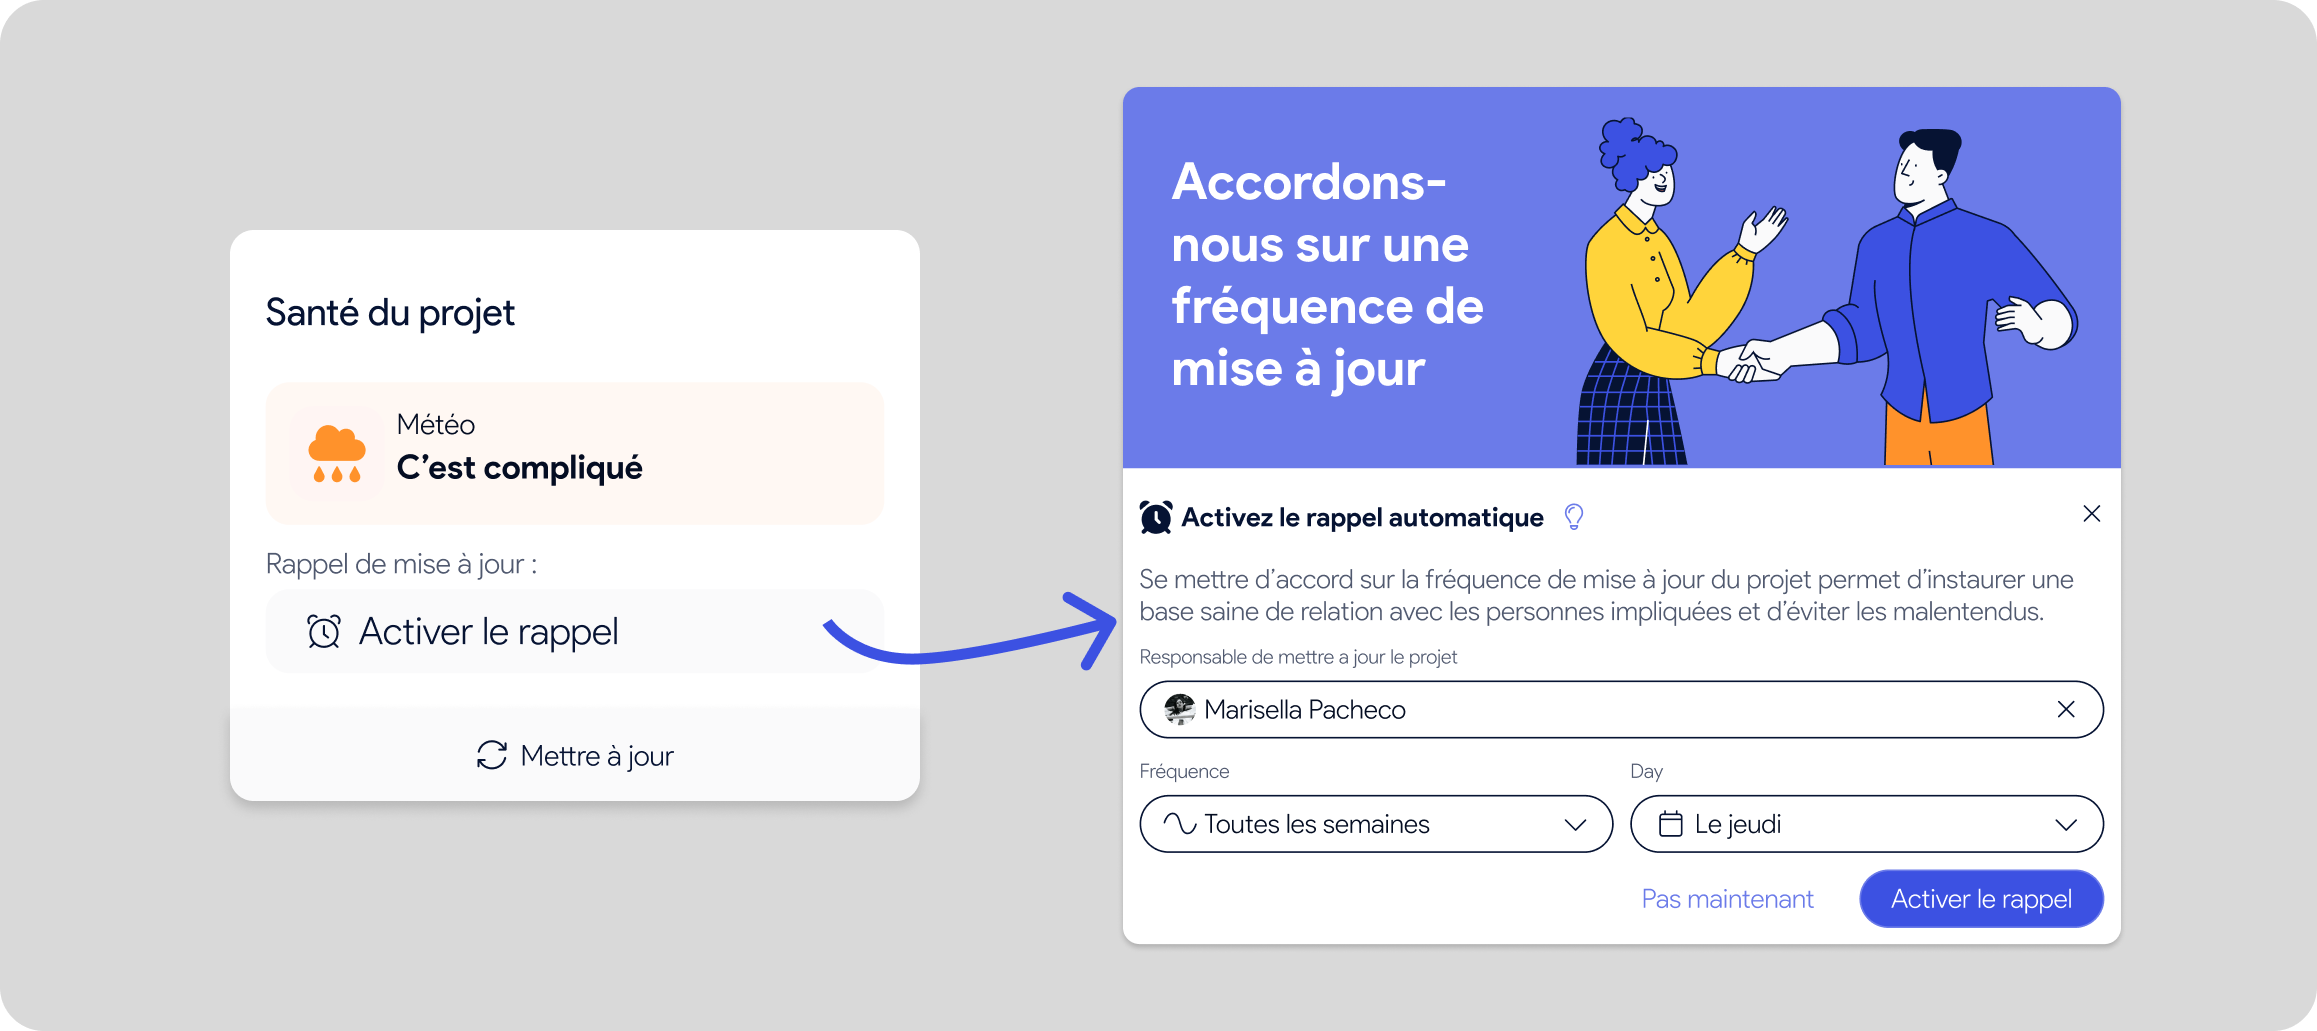
And since every project doesn't necessarily need a weekly update, here's our advice for setting up even finer tracking: agree with your project manager on a frequency for updating the project's health, thanks to the update-reminder option on the project page.
What production time for the report?
Before the arrival of a purpose-built tool, bureaucracy crept into every dashboard!
A CIO client testified that "an external PMO took him 2 to 3 days per month to consolidate the Excel portfolio file and report on the state of project execution in a PowerPoint, at the risk of forgetting the important decisions to make".
A secondary problem, for the reader: the tool forces a full re-read versus a "view" of the delta on what has changed and requires attention and/or a decision.
With AirSaas, project reporting for management is done in one click, with a summary of progress, the decisions to make and the risks, and it will take your project managers no more than 5 minutes a week to surface this information.
For the PMO who authors the report, as for its recipients, time is precious.
What to remember
"You can only change what you can see."
As you'll have understood, it is fundamental to have a cross-functional project management office, or a PMO, focused on the project-reporting process for the (entire) company versus a single department.
The impact of data reports and indicators on the decision-making process is well known; on top of that, adding contextual information (why is the status orange?) is a powerful lever to make decision-making from your data easier.
Beyond all the best practices in report creation listed here, we can't stress enough the importance of reporting assistance to limit errors. Using a platform is today a "must have" within an organization.
And don't forget: effective PMO reporting = the key to leadership in the management committee.
While reporting is essential to steering the project well, you must never forget that there are women and men behind it. And that our reports are not an excuse to forget common sense, humanity and the importance of management.
Ready to dig fully into this topic? We (really) recommend reading this article that zooms in on the "how-to": "How to build an effective project report?"
What if you took back control of your project portfolio?
Book a demo and discover the tool in 30 minutes.