October 8, 20218 min readSimon Vacher
How to build an effective project report?


Contents
A communication and analysis tool, the project report is meant to give regular updates on a project's progress and to present project information in a meaningful way. It is an action-oriented tool that should enable a steering committee to make sound, rational decisions.
If you're a project manager, or regularly involved in managing projects, you know that today project information is no longer a scarce commodity. Analyzing it, shaping it and interpreting it — that's the real challenge of a well-built report and of well-managed project delivery.
Project reporting remains a delicate exercise: an overabundance of information and the multiplication of reporting tools tend to dilute the message without sparking the recipients' interest. In this article you'll learn what a project report is really for and how to improve the quality of your reporting to make it truly effective and interesting for every member of your team.
And as a bonus, you can download our (100% editable, PowerPoint format) project reporting template here.
What is a project report?
Reporting is now firmly established in company culture: Product Manager, Product Owner, developer or manager — you've all received a project report in your inbox or through a collaborative tool. And sometimes you're the one who has to build one.
You could define a report as a staging of information and data about a project, collected at a given point in time and presented clearly enough for other people to use them and make decisions.
What is project reporting for?
The premise of project reporting is that by relying on performance indicators (also called KPIs, for Key Performance Indicators), you can measure and steer a project's trajectory effectively — or, conversely, spot certain blocking points.
In any case, the whole point of a project report is action, task planning and decision-making. To achieve this, the best project reports all have one thing in common: they let the reader visualize the information at a glance, so that everyone, at their own level in the company, can make the right choices.
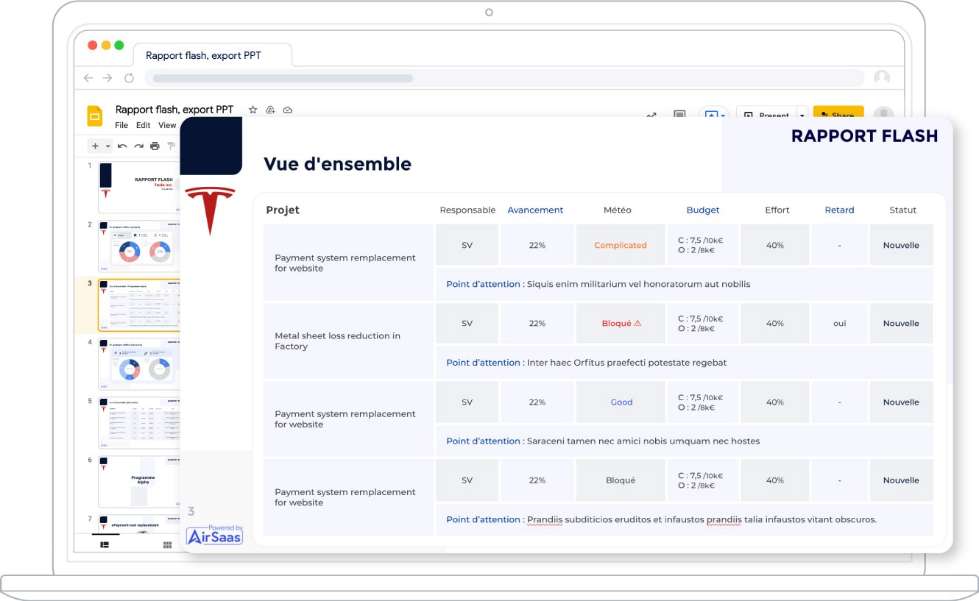
Project overview
Project management geared toward action
Above all, reporting is a decision-support tool — not at all the control tool it's often assumed to be. It should prompt stakeholders to ask questions: "What's next for the project?", "What skills do we need?", "Why are we behind on this specific point?", "Why is the delivery pace slowing down?". These are all the questions the project team members should be able to answer if the report is relevant.
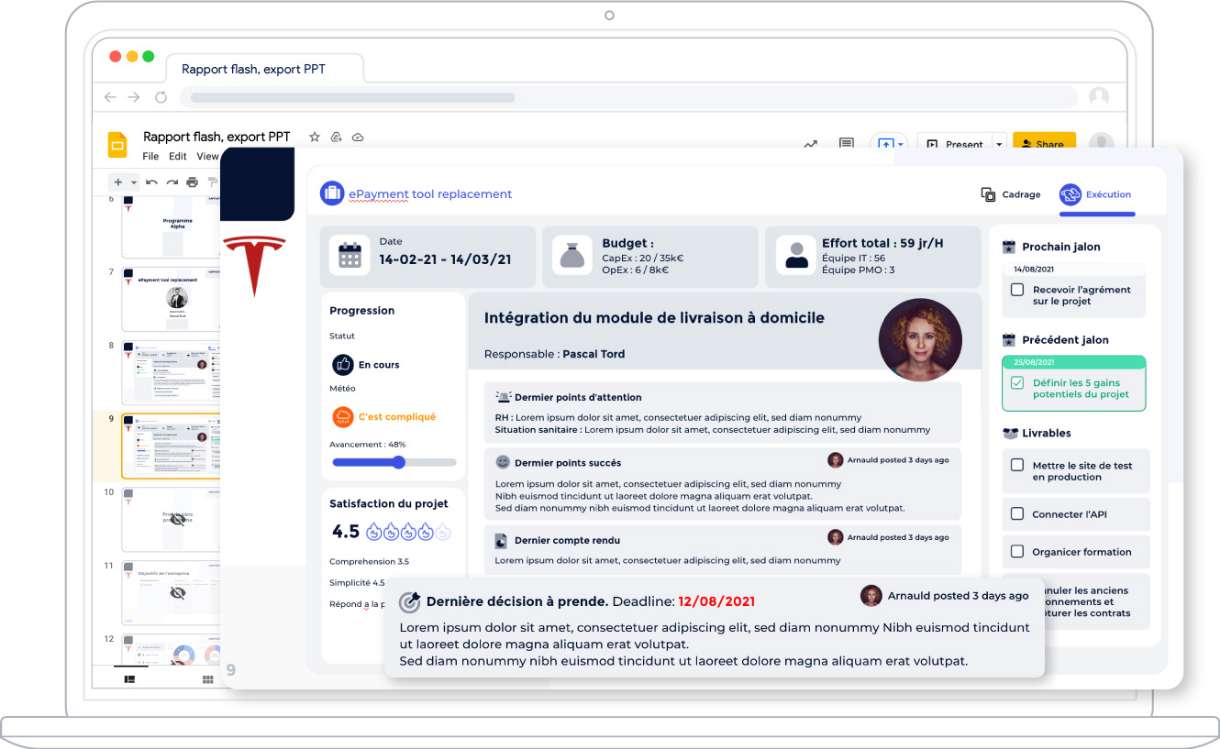
Highlight the decisions to be made
What information should you include in your report?
Building a project report is a good idea, but what information are you going to select, and what will you highlight? This is probably the most important point covered in this article: how do you get the right information and the right messages across to the right people?
A report is not a catch-all where data piles up. It's not up to each reader to sort through it — it's up to you to organize the information to give it overall coherence.
You therefore need to draw a direct line between the data you choose to display in your dashboards and the needs of the different recipients. So the first question to ask isn't "What data should I include in my report?" but:
"Who will read these indicators and what do they expect from them?", "What solutions can my report provide to the issues raised last week?"... And only then: "What key information do I need?"
Different stakeholders, different needs
For top management
For a CEO, a CFO and top management in general, time is rare and precious. They probably have a full project portfolio to manage. This audience needs to get a quick overview of a project in order to make macro-level decisions.
For business teams
An operational team, on the other hand — developers or programmers, for example — will pay more attention to efficiency and productivity indicators to assess their performance.
For managers
Finally, a manager will use the project report as a tool to involve the project's stakeholders and make the project's stakes and pending decisions visible.
How to collect the data for your report?
Building a project report can quickly become a very time-consuming task if you're poorly organized or don't have the right tools.
The right collection tools
One of the keys to saving time is knowing where and how to collect the data you need, and which indicators you're going to highlight.
An integrated reporting tool (like AirSaas) intelligently automates the collection of the information you need to build your report. Connected to the collaborative tools you use every day, it's probably the safest way to aggregate data quickly and give it meaning.
The right reporting frequency
How often you send your report depends on two criteria: the period you want to analyze, and when your stakeholders need that report.
Also make sure you have recurring access to the information you need, to avoid gaps in the data for the next edition.
The best teams using AirSaas send the flash report to their stakeholders once a week. (Yes — once a week, not once a month...!)
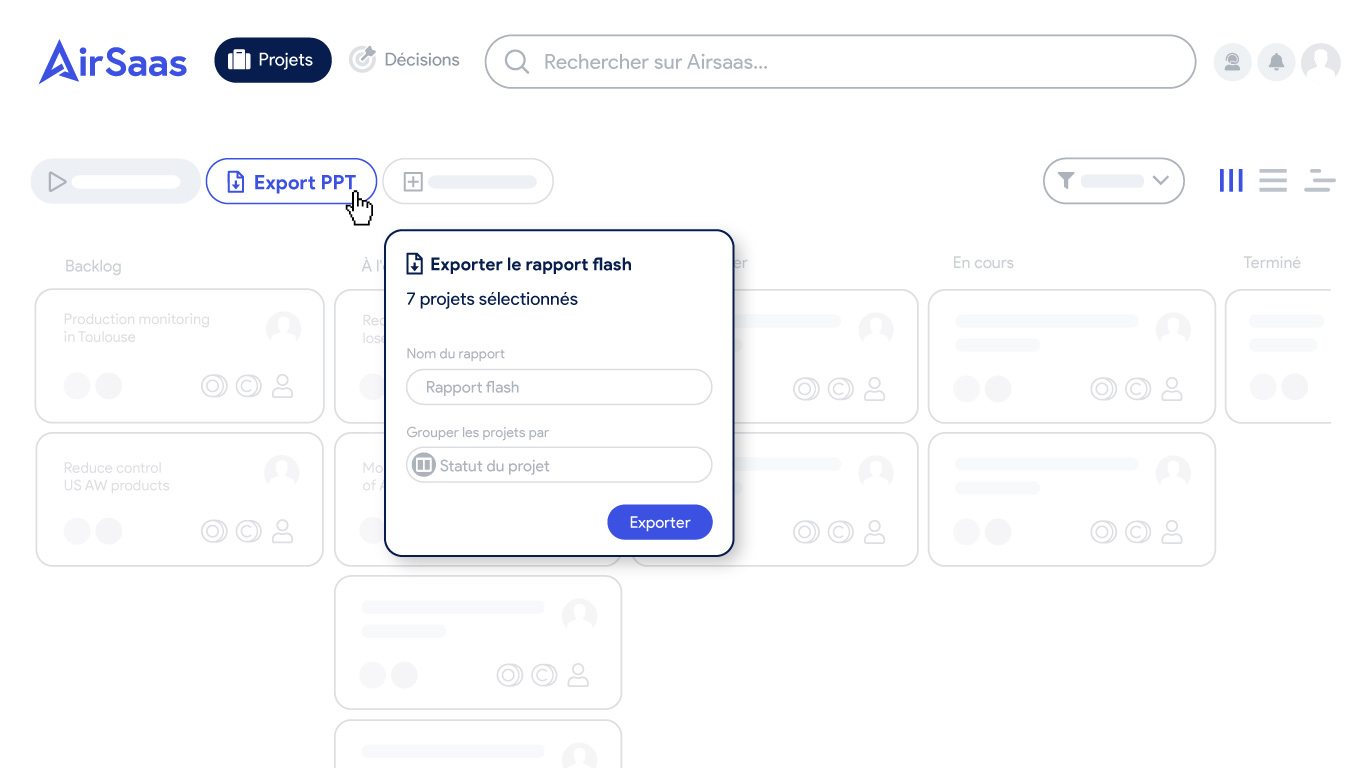
One-click PPT export of the flash report
Adapt the number of indicators to your project
In project management there's one watchword, whatever report you're building: keep it concise! A small number of indicators doesn't mean your report won't be relevant.
Less is good!
On the contrary, you'll show that you took the time to choose your KPIs carefully and that you genuinely care about the project. The flaw of many reports is that they tend to drown you in a flood of useless information. Don't fall into the data-overload trap — it's THE trap we all fell into at the beginning.
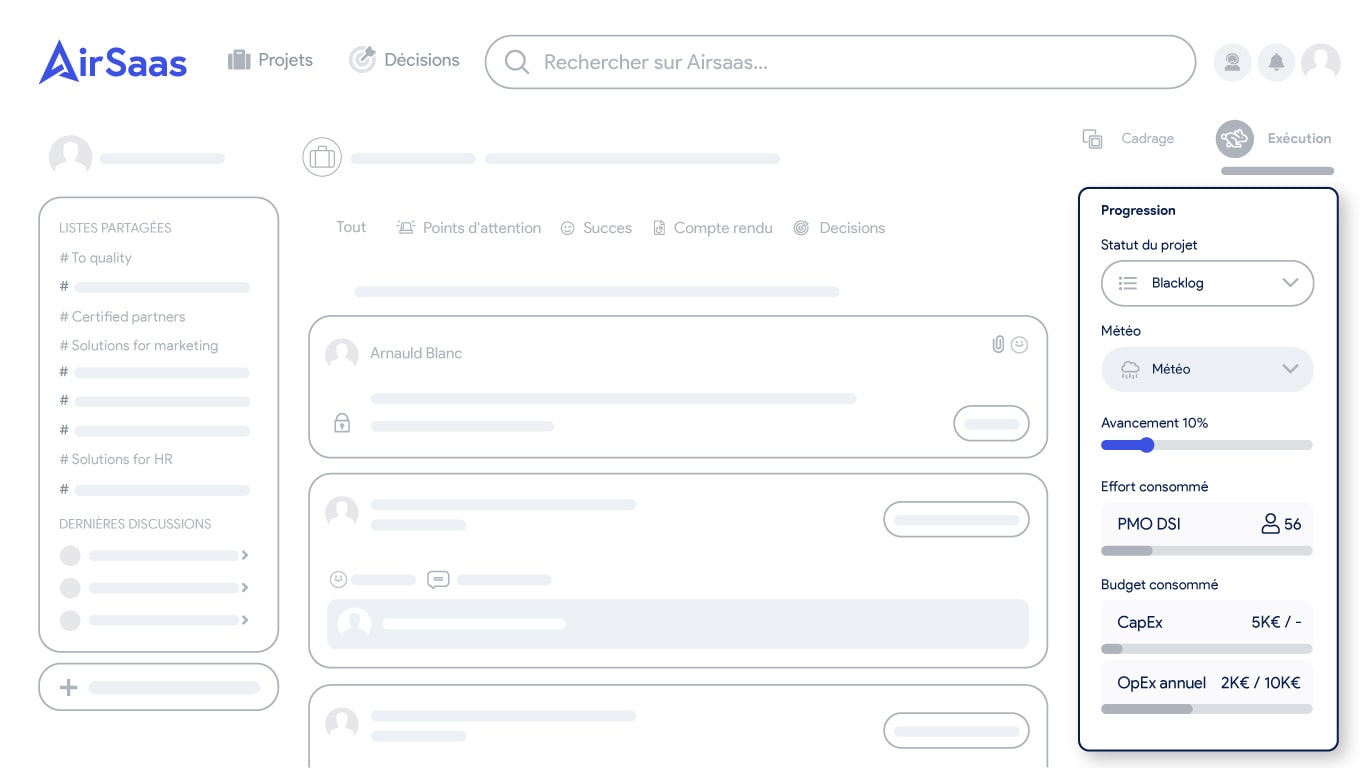
Evolution of project budget and time
The right level of granularity
A good report presents information at a carefully chosen level of granularity. Remember to organize your indicators in order of importance.
For a project report sent to very heterogeneous audiences, we strongly recommend building it as a summary, with easy access to a more detailed report when needed.
The little extra that makes all the difference
Project management specialists know it: a project's true health is also measured through the least visible indicators — the hidden performance indicators. Of course, it's impossible to know exactly what's going on in team members' heads, but some signs never lie: meeting attendance, recurring delivery delays, multiplying functional bugs, or an accumulation of careless mistakes are all indicators of a project's (good) health and of the level of commitment.
The keys to modern, effective, engaging reporting
With all the presentation and information-sharing tools out there, austere, hard-to-read project reports no longer have any reason to exist.
Form matters as much as substance. An effective project report makes people want to read it, comment on it and share it. It is first and foremost an analysis tool, and its added value is enabling action. To get there, several points are worth considering:
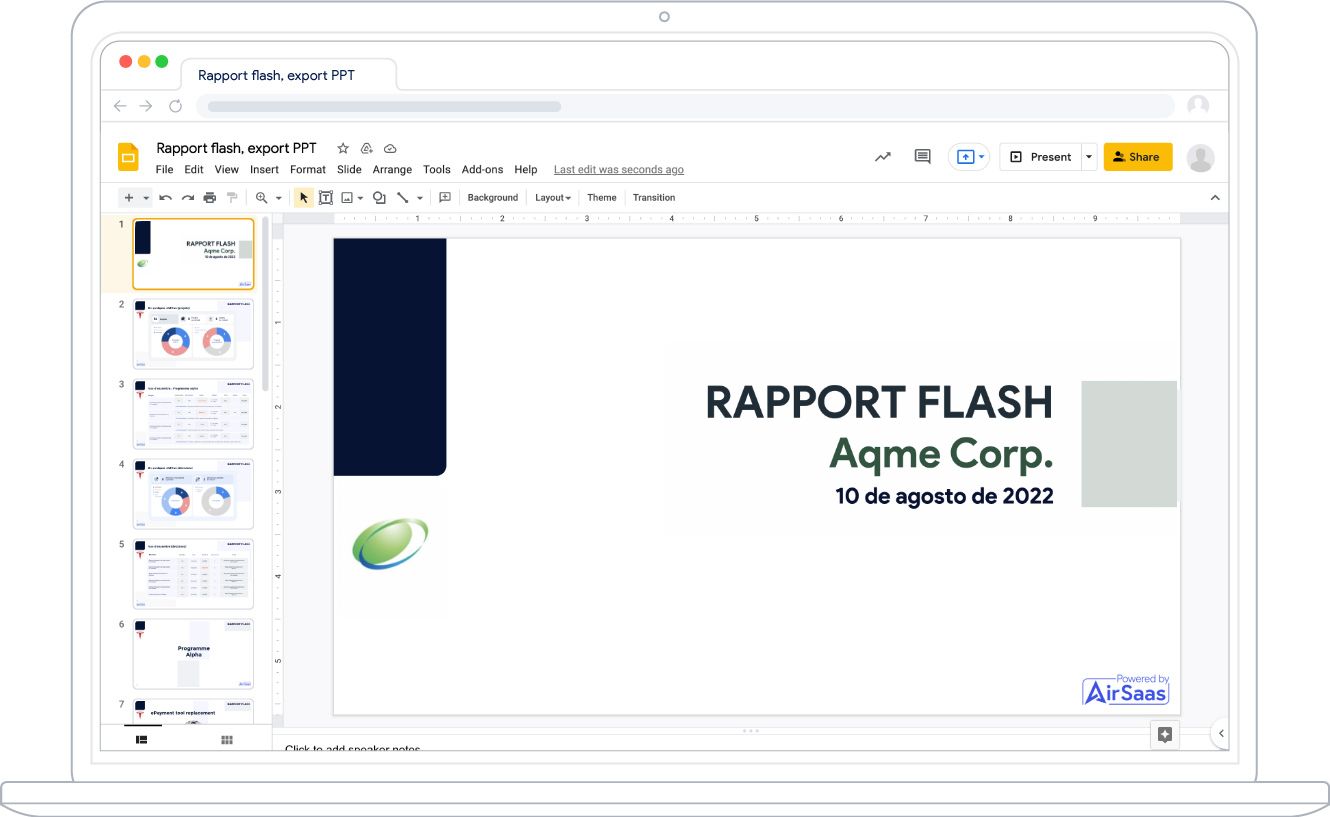
The summary of your project sheets: the flash report
Use shapes and colors:
Don't be afraid to tap into your creativity and draw attention with colors, to highlight the most important information and trends. Reuse the same color code across all your reports to get your audience used to your way of working.
One idea = one chart
In project management, key ideas absolutely must be illustrated in a simple, punchy way to be remembered.
Some project tracking and management tools like AirSaas offer different ways to visualize the data related to your activity, so information flows faster within the company. From one report to the next, the data updates automatically to save you time.
Bet on collaboration and participation:
The best project report is the one you spend as little time as possible on — but that gets everyone on the same page.
By involving stakeholders in project tracking you get a double benefit: up-to-date data that the people involved commit to, and a collaborative process where everyone contributes their part. Tap into collective intelligence!
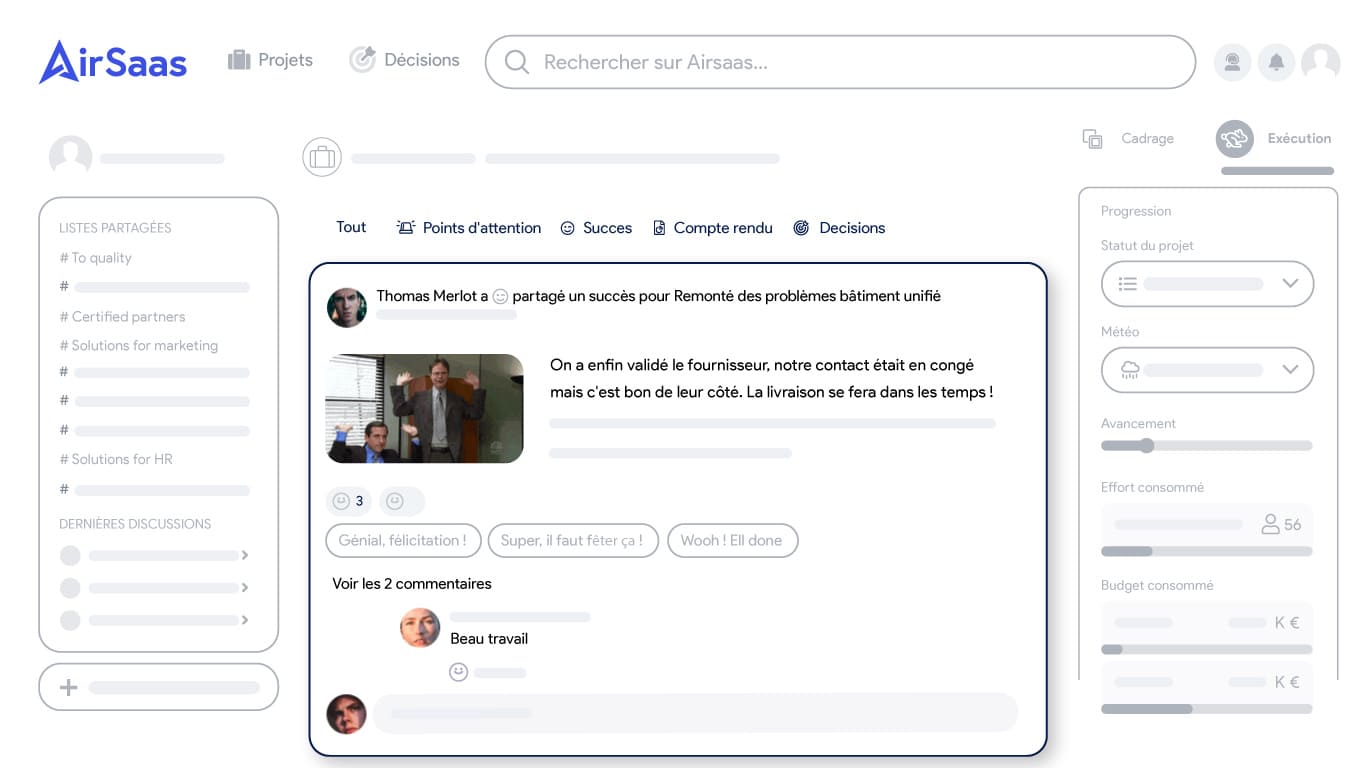
Share your project wins — don't keep them to yourself ;-)
Which tools should you use in project management?
Using integrated tools means spending very little time on project reporting and focusing on the added value of the tasks at hand. And no, it's not "normal" to spend 3 days a month building PowerPoints...
In fact, it's more accurate to talk about project tracking, since the data is updated and available at any time, in a visual, explicit way, to every team member. With this kind of tool, the whole team levels up and truly has the means to focus on its real mission.
Among the tools commonly used in project management, you'll find in particular:
- The paper to-do list — yes, really! It works very well on projects where you're on your own and everything depends on a single person... An endangered species :-)
- Microsoft Excel — the most widely used, but also the most static and the hardest to keep up to date. Oh well..!
- Monday, Asana, Wrike as SaaS, or other open-source solutions focused on task management.
These are indeed project management tools — but not project steering tools. Project management tools are centered on tasks and Gantt charts.
AirSaas, the project steering tool, is centered on decisions and reporting.
Used well, a project steering tool aligns the IT department, business teams and top management around the same objectives and better communication, breaking down the silos of an organization that is sometimes too heavy or compartmentalized.
With a shared tool where you pool your projects' data, it then becomes much easier to build a shared vision and move in the same direction, with a single project approach.
What if you took back control of your project portfolio?
Book a demo and discover the tool in 30 minutes.