Le tableau de bord que tous les DSI attendaient

Le vieil adage disant “on ne peut pas améliorer ce que l’on ne mesure pas” s’applique particulièrement à la Direction des Systèmes d’Information. Avant même d’“améliorer”, “mesurer” permet d’éviter les glissements rapides, propres aux métiers de l’IT, ayant des forts impacts sur le client, interne ou externe (retards, surcoûts, etc.).
La mesure et le suivi des indicateurs clés permettent ensuite les améliorations, les optimisations, la mise en place de stratégies de pilotage ambitieuses avec la Direction Générale.

pourquoi AirSaas

AirSaas, AirSaas, the next-generation CIO dashboard

At a time when business transformation is accelerating, when innovation is no longer confined to one department but is essential to a company's competitive edge, digital projects are multiplying, putting the IT department at the center of all attention. We've created the ideal dashboard to enable you to meet the expectations of Top Management and become the leading business partner for your business units.

Value-driven management

The key to success for your company is to prioritize the investments that will bring the most value. Your role as CIO is to install governance and indicators to make the right decisions, in order to optimize the management of the projects to be carried out.

To do so, you need to be able to bring together management members, around a CIO dashboard that presents the essential project data, to make seamless decisions.

The main KPIs you need are of 3 kinds:

  • Planning and monitoring projects
  • Resource management
  • Budget management

For planning, AirSaaS offers three views, each with a different purpose

The list view allows, for a given state of progress, to review your projects and all their related indicators. What actions should be taken to move these projects to the next phase?

Des vues différentes pour mieux piloter les projets
Vue Kanban

Rather, the Kaban view is dedicated to analyzing how your projects are distributed according to their progress states. It helps you identify trends (a lot of projects waiting to be validated, too many projects in progress in parallel, etc.) and thus to optimize performance management.

The timeline view enables you to ensure the projects are well-organized over time. Are you overloaded at some point, are you going to deliver on time, are you late...?

Vue timeline

Engage with good communication

A successful project is a project delivered on time, with the right budget - but also a project that has a strong support from its final user. To do this, you must be able to involve them in the scoping and throughout the duration of the project build. Good communication is also essential to maintain the trust of your General Management. On a daily basis, you need to draw up a picture of the progress of projects, of the evolution of key indicators, to monitor performance and to survey team engagement. Remember people remain the number one factor in the success (or failure) of your projects.

To do this, we provide you with two tools.

Pilotage de projet
Choisissez de gagner du temps et du contrôle

Adoptez dès maintenant une solution efficace de flash report projet

Automated flash report

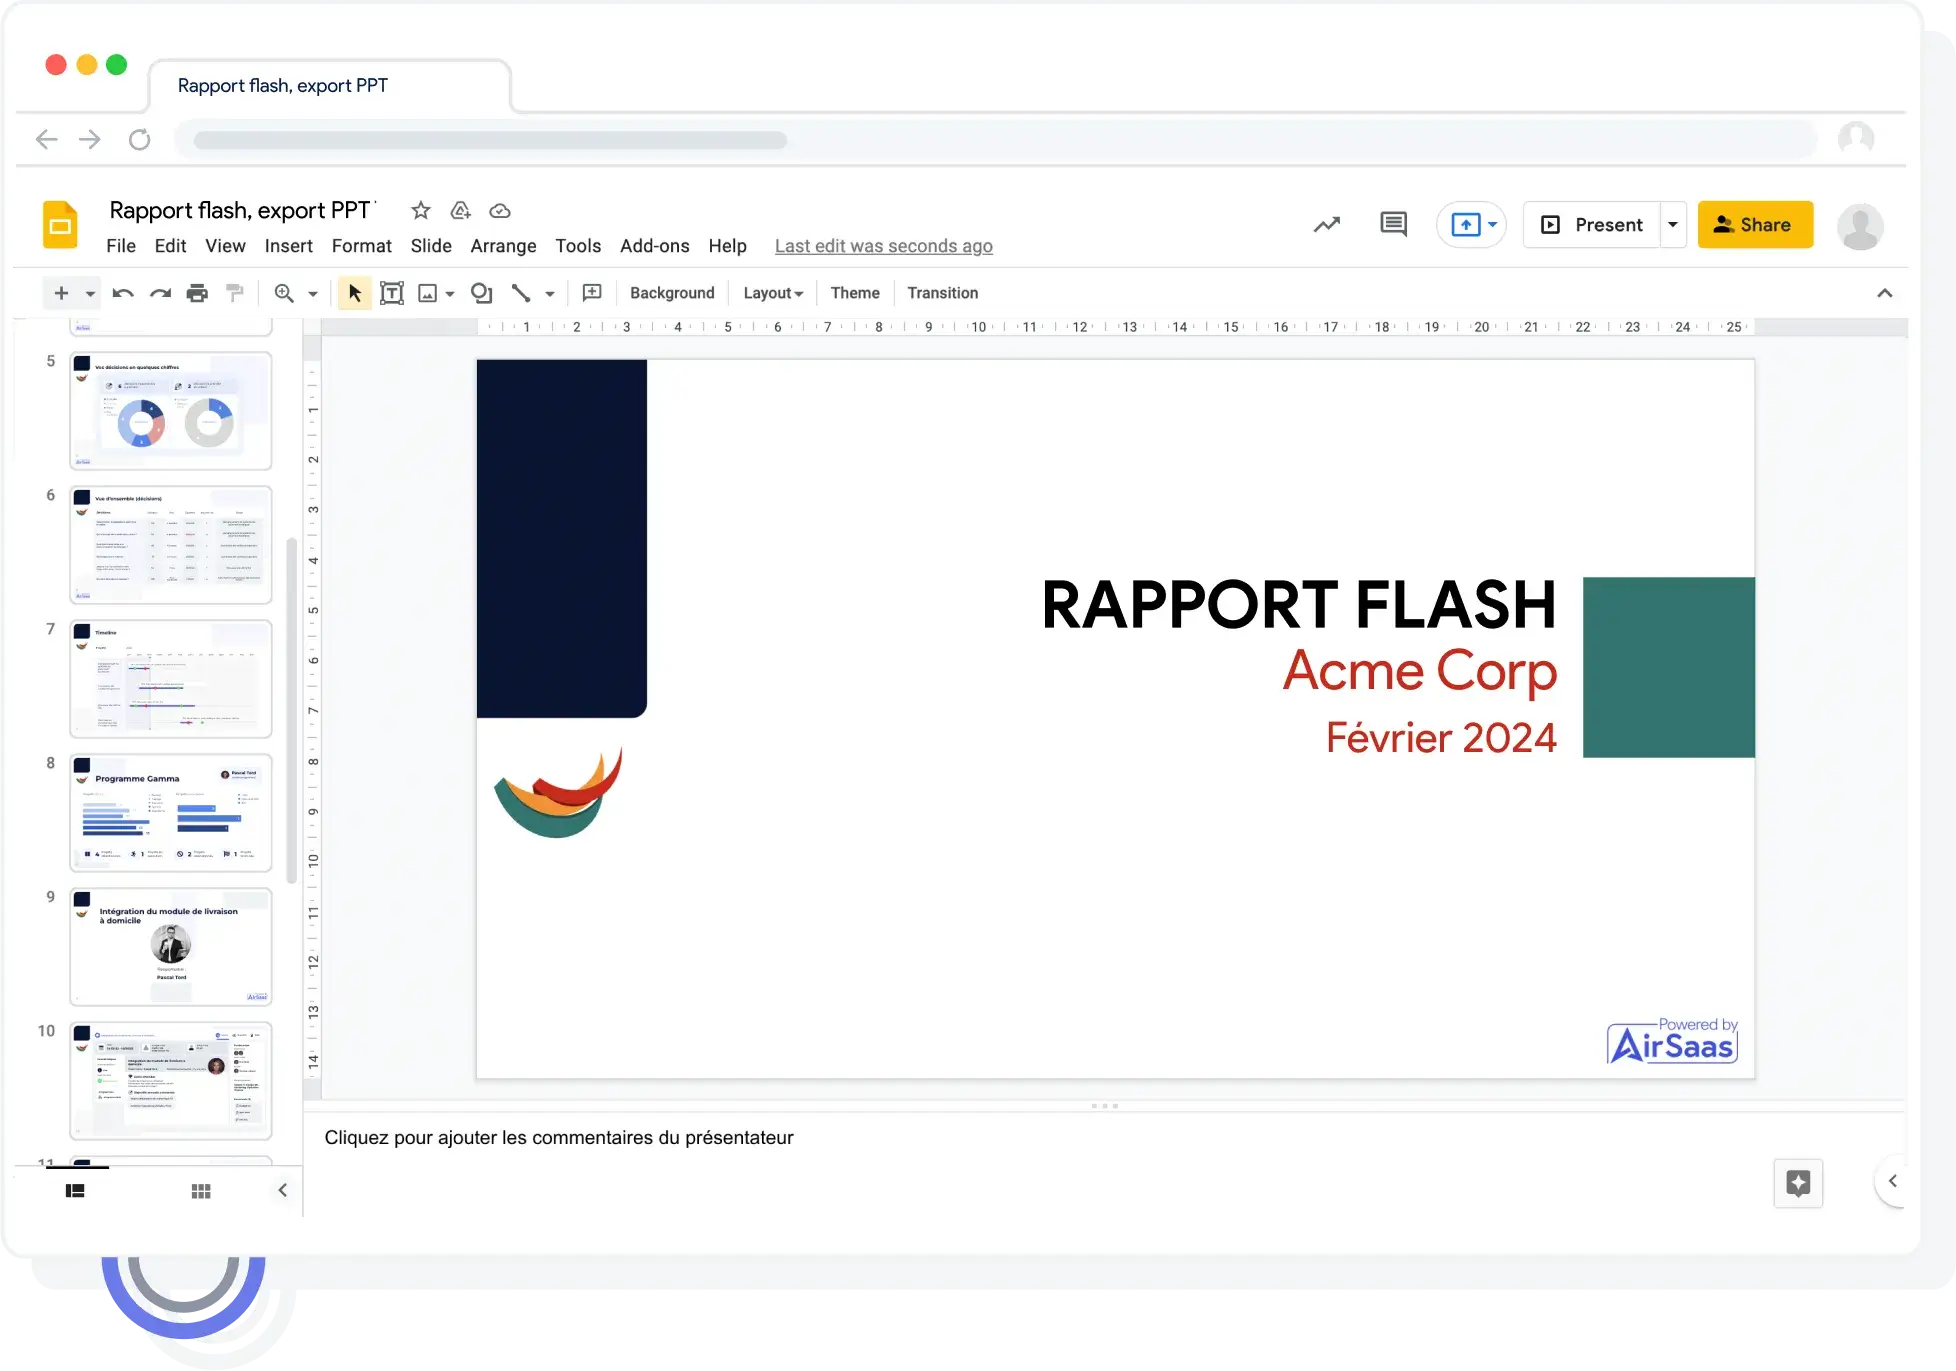
Reporting is essential. However, it is time consuming and often overlooked. With Airsaas, generate flash reports in one click, in PDF or PowerPoint format, and keep stakeholders informed of the progress of your activities.
Our flash report brings together the projects you want to communicate about. For each of them, two slides are generated: a slide summarizing the scoping information, and one containing the key elements of the execution.

Rapport flash
Sondage collaborateur

Monitoring team engagement

We provide an anonymous survey tool to assess the confidence of stakeholders in the success of the current project. The higher this level of trust, the more likely your project is to be successful. On the contrary, if it is weak, you have to act quickly. Nothing is worse than a project that is completed but does not correspond to the user's needs.
In one click, send the survey to all the people involved in the project. Do it at regular intervals and avoid unpleasant surprises in the management of your projects.

Become a profit center rather than a cost center

Historically, the IT department has always been seen as a cost center. Formerly under the responsibility of the Finance Department, the IT department is now increasingly valued and has its place on company steering committees.

Transformer la DSI
tableau de bord DSI

In an effort to improve company performance (innovation and optimization of processes) it is important to make sure:

  • Your projects contribute to your company's goals, as defined by Top Management
  • Each project and their gains are defined and measurable

Airsaas's CIO dashboard enables you to track the value generated by IT for the whole company.

All managements had their dashboards - you now have yours

You probably didn't wait for AirSaaS to build your own CIO dashboard - and that's good. Following feedback from several dozen CIOs, we developed a performant management dashboard for CIOs.

Structured data

CIO dashboards are often set up on Excel or on visualization tools. AirSaaS connects to your project management tools and offers you a more abstract view of your project portfolio. Your data is consolidated around projects, partner solutions, teams involved, etc. to allow you to display and monitor essential indicators for your activity.

Pilotage de projet
Pilotage de projet

Smart indicators to help with your decision-making

The goal here is to provide information to CIOs in order to simplify decision-making for them. For example, when a project has required decision-making for several weeks even though it is strategic for a business unit, you gave to be informed, in order to optimize your IT department's efforts.

Simple and collaborative by design

It's crucial for you to involve teams in this process. To do this, you need a simple tool that does not require training and allows you to work together according to everyone's access rights. AirSaaS was designed as a meeting point between the IT department and business departments.

Pilotage de projet
Choisissez de gagner du temps et du contrôle

Adoptez dès maintenant une solution efficace de flash report projet

Why do you need to use a dashboard to manage your IT department?

Before, CIOs used to focus mainly on technical issues. But today, they are becoming more and more business-oriented: the management of the information system is now considered in a company as an important lever for creating value.

But if you she wants to be in a position to help your company achieve its business goals, the way you manage your IT department must be optimal. And this is where a well-concieved CIO dashboard becomes essential to IT governance.

Indeed, if an organization wants to evolve, it must necessarily give itself the means to evaluate itself. If not, how do you know if it is progressing and achieving its goals?

Thus, a prospective dashboard is the tool that allows you to ensure effective management through short, medium and long term goals. The purpose of your dashboard is to ensure that your goals will be achieved without being hampered by operational or organizational issues.

To summarize, a CIO dashboard allows you to:

  • Ensure optimal management of the IT department
  • Establish effective internal communication
  • Identify trends within the company
  • Follow-up over on each of your goals
  • Analyze differences between the goals set and those achieved
  • Empower each employee by assigning them goals

How important are the KPIs you choose?

Pilotage de projet

The unfortunate transposition of traditional management systems to CIO dashboards

CIO dashboards, IT departments have been often evaluated using dashboards and KPIs that weren't adapted to their activity.As Philippe Rosé and Christophe Legrenzi explain in their book

Indeed, performance indicators from the industrial world were transposed into dashboards in order to analyze their activity. However, these traditional management indicators (including accounting or even budgetary control) are not at all suited to the development of an information system maintenance dashboard that monitors activities that, by nature, are transversal. Conversely, these indicators in the industrial world were designed to control costs. They aim to divide each operational service into smaller units, in order to know the cost that each of these units and, thus, to be able to think of methods to reduce these same costs.

Thus, the transposition of these indicators into CIO dashboards was harmful to the evaluation of activities relating to IT management. It has also impacted the way in which CIOs are perceived in companies and in many medias.

  • The technological and financial aspects of CIOs were correctly assessed by these performance indicators in the dashboards, but they proved to be unable to process information relating to communication, employees or even to the management of the company's strategy.
  • The information processed by these indicators relates to the past and the present, but very rarely to the future. These dashboards are therefore much closer to a simple activity report than to a real performance management tool!

Thus, it is not uncommon that the information provided by the IT department's dashboards don't really reflect its overall activity, and is essentially focused on controlling budgets and managing technologies.

From a cost center dashboard to a profit center dashboard

This way of evaluating the performance of the IT department has necessarily led companies to analyze information systems according to what they cost. Consequence: the management of information systems via dashboards is mainly based on costs and not by the value they can provide.

Pilotage de projet

Here is an example. It has been proven that a large majority of CIO dashboards integrate a concept of budget, while only 20% of them have set up indicators in order to assess the value produced by the IT department!
Therefore, we understand that Information Systems are mostly perceived as cost centers and not value centers. And if companies have become used to focusing their dashboards on costs rather than on value, this is partly because industrial management systems have been transposed, but also because inventing indicators to measure the value produced by an IT department is complex!

Pilotage de projet

A CIO department dashboard that serves general management

CIO dashboards are essential for general management if the latter wants to properly manage the digital transformation of the company. In fact, the KPIs on the management dashboard are essential to report on the management of the IT department and to provide information allowing optimal governance of the company's human and budgetary resources.

Among the main uses of the management dashboard, we can quote:

  • What is the total cost of IT in the business?
  • Are resources committed to the projects that provide the most value?
  • To what extent does IT bring value to the various departments and to the overall performance of the company?
  • How good is the performance of IT compared to the competition?
  • What are the future projects to invest in?

Many of these questions are oriented towards the costs of the IT department for the company (which represent on average between 1% and 5% of the total company budget depending on the sectors), but several of them require KPIs that focus on the value produced by the IT department.

However, many dashboards submitted to general management are focus mainly on an analysis of the budgetary dimension. Thus, by looking at dashboards, a large number of CEOs are faced with an easy solution: judging the performance of the IT department according to the ratio between the IT budget and the company's turnover.

The main performance goal therefore becomes not to spend too much - even though it is obvious that the performance of an IT department cannot be evaluated by its simple ability to stick to budgets.

Worse: it can be tempting for CEOs to compare the budget spent by their company on their IT to the amounts invested by competing companies. But it has been shown that each company does not define the budgets that should be considered invested by the IT department based on the same principles! Moreover, depending on the sector, digitalization needs are not at all similar.

Thus, trying to compare themselves to their competitors through the budgetary prism is a trap for CEOs.

General Management must therefore encourage CIOs to create balanced dashboard KPIs that allow them to measure their performance according to the value created in relation to the strategic interests of the company. Management that haven't understood the importance of optimizing these indicators to influence the overall strategy of the company are falling behind their competitors.

How to build relevant CIO dashboard indicators?

The main principles of good dashboard indicators

Following a few formal principles when constructing dashboard indicators is essential to control your IT department's management:

Pilotage de projet
  • All the indicators on the CIO dashboard must be named
  • All the indicators on your CIO dashboard must be defined, and their definition must be known by everyone
  • Each indicator on the dashboard  must have a goal: without it, it becomes useless
  • The indicators must take into account the past, the present but also the future
  • Consider building dashboard KPIs evaluating results (static) but also processes (dynamic)
  • Build your dashboard indicators so that they can be comparable between them.
  • Indicate how often the dashboard KPIs should be updated (annual/quarterly/monthly/daily...)
Pilotage de projet

Think of dashboard indicators as a reflection of the company’s goals

Although you can see dashboards with performance indicators already designed and planned to be applicable to any business, the optimal solution is to customize your own.

Each CIO dashboard must be built with regard to the company's goals: these must reflect its strategic ambitions.

Each organization has a specific functioning, so a generic IT dashboard will have limited effectiveness. Thus, the most effective dashboards are those that describe the management of it in light of the context of their business.

A CIO dashboard is therefore complex to build and requires taking a step back from the company's activities. One of the best methods to create at a dashboard that represents your reality is to involve business units in its design.

Pilotage de projet

Involve business units in the production of your dashboard KPIs

Often, business units are very little (or not at all) involved in the construction of KPIs and CIO dashboards. This is additional proof that the majority of those dashboards are created on a logic centered on IT, even though the direct beneficiaries of the solutions provided will indeed be business units.

Involving business units in the development of dashboards is essential to make your KPIs stick to the real situation of the company. The ideal is to form teams made up of business managers (if possible volunteers) accompanied by members of the IT department. This way, business managers will be able to indicate which areas bring them the most value and which therefore seem to them to be the most relevant to assess and monitor regularly using a CIO dashboard.

To sum it all up, build your dashboard indicators:

  • By respecting the principles of form, so that they are really usable
  • By adapting them to the specific goals of your business
  • By involving business departments in their development

If you follow these principles, you will have a good chance of creating a CIO dashboard that really allows you to manage your IT department in an optimal way.

Discover how AirSaas can help you